 IMAS Metadata Catalogue
biota
Type of resources
Topics
Keywords
Contact for the resource
Provided by
Years
-
Mesozooplankton community composition and structure were examined throughout the D’Entrecasteaux Channel, Huon Estuary and North West Bay, Tasmania, from November 2004 to October 2005, the data represented by this record was collected on the 17/08/2005. The composition of the mesozooplankton community was typical of inshore, temperate marine habitats, with seasonally higher abundance in summer and autumn and lower numbers in winter and spring. Copepods were the largest contributors to total abundance across all seasons and stations, while cladocerans and appendicularians were proportionally abundant in spring and summer. The faecal pellets of these three main groups, along with those of krill and amphipods, also contributed significantly to material recovered from sediment traps. Meroplanktonic larvae of benthic animals showed short-term peaks in abundance and were often absent from the water column for long periods. Spatially, North West Bay and the Channel had a higher representation of typically marine species, including Calanus australis and Labidocera cervi, while truly estuarine species, such as the copepod Gladioferens pectinatus, were more important in the Huon Estuary.
-

Mangroves are a globally important ecosystem subject to significant anthropogenic and climate impacts. Tidally submerged forests and those that occur in arid and semi-arid regions are particularly susceptible to sea level rise or are growing at the margins of their their ecophysiological limits. The spatial extent of these types of mangroves over broad scales are typically poorly documented as their structural and environmental characteristics make them difficult to detect using remote sensing models. This study utilised the entire Landsat 8 satellite collection between January 2014 and June 2021. A new cloud-based time-series method was used that accounts for tidal variance in detecting mangrove areas that are periodically inundated and have historically been difficult to detect with traditional remote sensing methods. A habitat area model was derived for remote North-western Australia and detected an additional 32% (76,048 hectares) of mangroves that were previously undocumented. The accuracy of the model was assessed within the distinct geomorphic zones of the region through visual validation from high-resolution imagery. See accompanying report for full methodology: Hickey, S.M.; Radford, B. Turning the Tide on Mapping Marginal Mangroves with Multi-Dimensional Space–Time Remote Sensing. Remote Sens. 2022, 14, x. https://doi.org/10.3390/rs14143365
-
Underwater video technology was used to observe marine mammal interactions (seals, in particular Australian fur seals) within midwater trawl nets. A camera system was placed inside the trawl net in the vicinity of a Seal Excluder Device, designed to prevent megafauna from entering the codend of the net and provide an escape point. Digital video data was described according to a range of operational, catch and interaction fields, and made time-specific to each trawl shot. Data is linked to commercial catch and effort data providing operational, environmental and catch information.
-
Fish annotations of stereo Baited Remote Underwater Video and panoramic drop camera imagery, were completed as part of a report funded by the NESP Marine & Coastal Hub. This report focussed on an IUCN II zone in the South-west Corner Marine Park off the 'Capes region' near Margaret River. These data were analysed in EventMeasure using standard operating procedures for the annotation of remote stereo imagery.
-
Sediment organic carbon assessments within plots of transplanted Posidonia australis seagrass, and compared to adjacent bare sand and healthy meadows, in Shark Bay, WA.
-
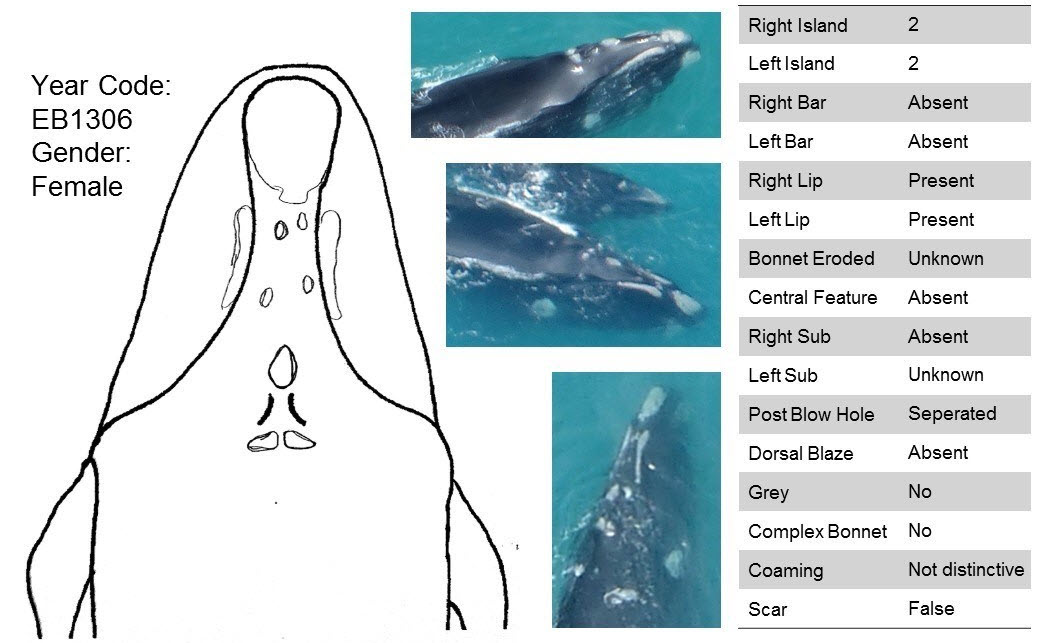
The population of southern right whales in the Southern Hemisphere has been recovering slowly from near extinction due to its decimation from whaling before its ban in 1935 and cessation in the mid-1970’s. As the species recovers, there is increasing evidence of expansion of aggregation areas, including breeding grounds off the coast of Australia. Consequently, there is a need to update known southern right whale established aggregation areas recognised nationally as Biologically Important Areas (BIAs), as well as the national Southern Right Whale Conservation Management and Recovery Plan, which are both used in decision-making using new evidence. This project collated over 2,000 images collected entirely opportunistically by researchers, volunteer citizen scientists, and whale watch operators, and completed matching of individually identifiable whales in photos (i.e., Photo-ID) between 1991 to 2021 in the southwest corner of Australia to evaluate abundance, residency, site fidelity and connectivity in this historically data limited region. The results are reported in the NESP report for Project 1.22 ("A photo-identification study of southern right whales to update aggregation area classification in the southwest of Australia"). A goal of this project was also to upload unique individual southern right whale Photo-IDs into the Australasian Right Whale Photo-Identification Catalogue (ARWPIC; AMMC 2021). The process for these Photo-IDs are briefly described here.
-
In this study, 34 fledgling Fairy Prions (Pachyptila turtur) recovered during a wreck event in south-eastern Tasmania in 2022 were examined for ingested plastics (number, mass, type, colour, and particle size) and body condition (e.g., wing chord length).
-
Biogenic marine habitats are increasingly threatened by a multitude of human impacts, and temperate coasts in particular are exposed to progressively more intense and frequent anthropogenic stressors. In this study, the single and multiple effects of the urban stressors of nutrification and sedimentation on kelp bed communities were examined within Australia’s largest urbanised embayment (Port Phillip Bay, Victoria). Within this system, grazing by sea urchins (Heliocidaris erythrogramma) plays an important role in structuring reef communities by overgrazing kelp beds and maintaining an alternative and stable urchin barrens state. It is therefore important to explore the effects of urban stressors on kelp bed dynamics related to urchin abundance, and test the relative strengths of bottom-up and / or physical drivers (e.g. elevated nutrients and sediment) versus top-down (e.g. urchin grazing) forces on kelp bed community structure. The interactions of these drivers were assessed to determine whether their combination has synergistic, antagonistic, or additive effects on kelp beds. It was found that kelp responds positively to nutrient enhancement, but when combined with enhanced abundance of grazing sea urchins, the local positive effect of nutrient enhancement is overwhelmed by the negative effect of increased herbivory. Turf-forming algae behaved very differently, showing no detectable response to nutrification, yet showing a positive response to urchins, apparently mediated by overgrazing of canopy-forming algae that limit turf development. No direct effects of enhanced sediment load (at twice the ambient load) were found on intact kelp beds. Collectively, the results demonstrate that the ‘top-down’ control of urchin grazing locally overwhelms the positive ‘bottom-up’ effect of nutrient enhancement, and that intact kelp beds demonstrate resilience to direct impacts of urban stressors.
-
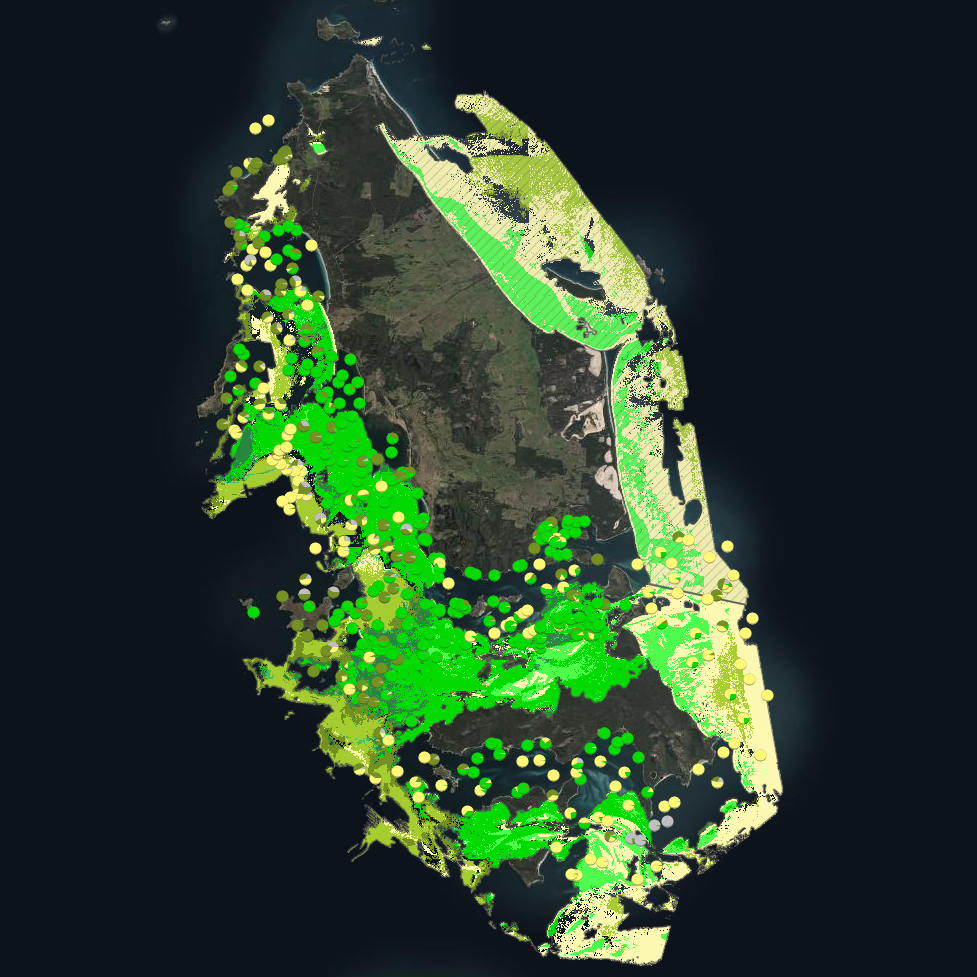
Seagrass beds are a dominant marine ecosystem of Tayaritja (the Furneaux Group of Islands) in the north-eastern waters off Tasmania. Historical coarse mapping has indicated extensive beds of Posidonia, Amphibolis, Heterozostera, and Zostera species, potentially comprising some of the largest and deepest seagrass extents found in temperate Australian waters. However, limited data on the distribution and ecological value of these seagrass habitats represents a significant knowledge gap in understanding Australia's wetland natural assets. This project mapped the extent, ecological composition, population structure, and blue carbon value of seagrass beds around Tayaritja, in partnership with the Tasmanian Aboriginal Centre. The study area focused on the coastal waters surrounding Flinders Island in the western Furneaux Group, with mapping extending from the high tide line to the depth limit of reliable optical detection (approximately 30 m), based on analysis of field data and satellite imagery capabilities in the region. This record specifically describes the benthic mapping component of the study. See https://doi.org/10.25959/WRXK-KV06 for imagery annotation data from the field validation campaigns. A combination of close-range remote sensing methods was used to map the extent and ecological values of seagrass beds. The approach developed through this study contributed to the creation of the NESP Standard Operating Procedure (SOP) for Seagrass Mapping using Optical Remote Sensing (https://sustainabledevelopmentreform.github.io/nesp-sop-seagrass-mapping).. High-resolution satellite imagery from Sentinel-2 (10 m) sensors, combined with bathymetric LiDAR data and oceanographic variables, was used to map baseline seagrass extent and composition. A field campaign deployed a Benthic Observation Survey System (BOSS) and unBaited Remote Underwater stereo-Video system (stereo-uBRUV) at approximately 400 locations to validate remote sensing outputs. From these data, maps were produced showing the extent and coverage of seagrass, sand, and macroalgae, and where possible, seagrass species composition, subject to water depth and clarity constraints. See the "Lineage" section of this record for full methodology. Three key types of mapping products were developed: ---Occurrence probability maps--- Continuous probability surfaces (0-100%), modelled from presence/absence data, indicating the likelihood of habitat presence at each pixel for: • Seagrass (all morphologies; > 5% cover observed in underwater field imagery) • Macroalgae species/assemblages • Sand ---Habitat percentage cover maps--- Quantitative estimates of percent cover for each habitat category: • Seagrass (all morphologies) • Macroalgae species/assemblages • Sand ---Derived products--- • Baseline binary presence/extent maps derived from optimised probability thresholds: ○ Seagrass: sgprob > 0.5 & sgprob > macroprob & sandcover < 0.9 ○ Macroalgae: macroprob > 0.5 & macroprob > sgprob & sandcover < 0.9 ○ Sand: sandprob > 0.5 & sandcover < 0.2 • Predicted seagrass species composition of binary extent map. • Fractional cover visualisation: combining cover percentages of multiple habitats into a single composite product • Composite habitat maps: combining binary habitat extents and delineating mixed habitat classes These complementary products serve different purposes: probability maps provide confidence measures, extent maps delineate habitat boundaries, percent cover maps support quantitative analysis of habitat density patterns, and composite habitat maps represent the diversity of mixed habitat classes. Together, they provide a comprehensive understanding of seagrass and associated habitat distribution across the study area.
-

This record provides an overview of the NESP Marine and Coastal Hub project "Aerial survey of the Southern Right Whale 'western' sub-population off southern Australia". For specific data outputs from this project, please see child records associated with this metadata. -------------------- Southern right whales are listed as Endangered under the EPBC Act and are a species of national conservation significance. Monitoring of their recovery is guided by the Southern Right Whale Conservation Management Plan, which aims to improve the population’s conservation status through regular assessment of population size, calving intervals, and spatial trends. This project continued the long-term aerial survey program of southern right whales along the southern Australian coast, spanning from Perth (WA) to Ceduna (SA). Annual surveys have been conducted since 1993, providing a continuous long-term dataset for the 'western' population and supporting national assessments of connectivity with the smaller ‘eastern’ population. The surveys contribute essential data on population trends, calving rates, and movements of individuals. The August 2022 aerial survey ensured an uninterrupted time series in the long-term population trend data. This is particularly important given the species' non-annual breeding cycle (typically every three years). Annual surveys are essential to maintain an acceptable level of precision in estimating population trends and key life history parameters. A total of 526 whales were recorded, including 247 cow–calf pairs, 31 unaccompanied adults and one yearling. Based on long-term models, this equated to a population estimate of approximately 2,675 individuals, with an average annual growth rate of ~5.3%. While this represents a continued population growth, results suggest a possible slowing in the rate of growth over the past 13 years (from 7.5% in 2009). The 2022 survey also recorded the lowest number of unaccompanied animals in the entire time series, extending a five-year trend of low sightings in this group. Continued monitoring of the population is needed to assess whether these changes represent longer-term shifts in population dynamics and calving intervals, and to inform adaptive management for this long-lived, slow-recovering species. Outputs • Estimate of relative abundance and population trend compared to long-term aerial survey sightings [dataset] • Individual whale photo-identification data - 2021-22 season [imagery - published to ARWPIC] • Final technical report detailing overall numbers of southern right whales observed within the survey region, their gender (and life stage where possible) and spatial distribution of individuals [written]