 IMAS Metadata Catalogue
diver
Type of resources
Topics
Keywords
Contact for the resource
Provided by
Years
-
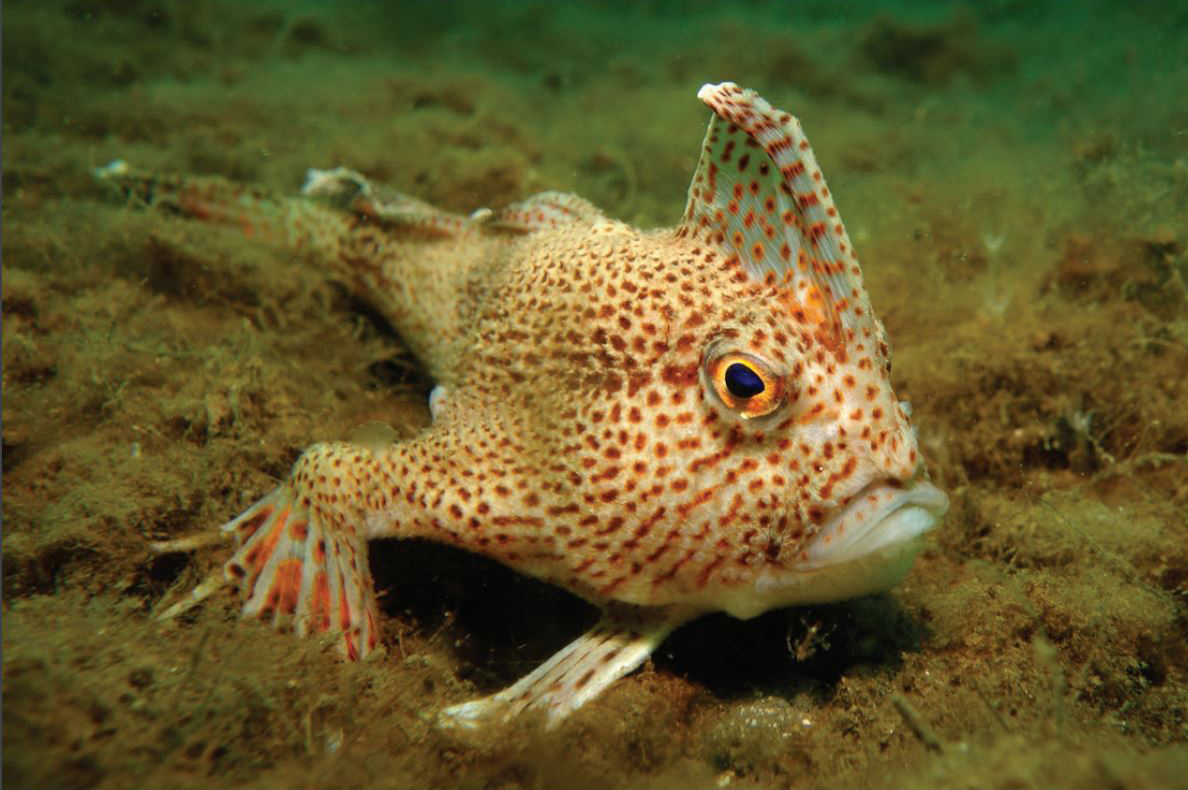
Dive surveys were conducted in 2014 and the same sites resurveyed annually until 2022 (excluding 2021), to establish a baseline and monitor the status of the critically endangered spotted handfish (Brachionichthys hirsutus) population. This dataset is a summary of all surveys season 2014 to 2022 (excluding 2021) in which the 11 sites across the Derwent Estuary and D'Entrecasteaux Channel were assessed. The data describes the search effort (transect length, swathed area) and counts of handfish observed on each transect, including size measurements (total length) and depth records for each sighted fish.
-
The data here presented shows the relationship between sea urchin numbers and algal cover in the Western Mediterranean. Data was collected in several underwater surveys using subdivided quadrats. The grazing effect of urchins on the macroalgal community was evaluated.
-
Aquatic flora surveys were conducted in Wilson Inlet in 2007 and 2008. This data is part of the 2013 report "Synthesis of seagrass mapping studies" conducted by the Water Science Branch of the Department of Water. The 2007 survey was conducted to review any changes in seagrass distribution since the previous survey in 1996 (data not included in this record), and was funded internally by the Water Science branch. The 2008 survey was conducted by the WA Department of Water together with Geoscience Australia. The objective of the 2008 survey was to collect baseline data on seagrass composition and distribution in key estuaries of southern and south-western WA. This data was acquired by the ACEAS Seagrass Group as part of the 2013 Australia-wide risk assessment of Seagrass. Surveys were conducted again in December 2017, April 2018, December 2019, December 2020, December 2021 and December 2022 by the Department of Water and Environmental Regulation as "Wilson Inlet Seagrass Survey". The datasets making up the 2007-2008 Wilson Inlet seagrass survey data are: WA_WilsonInlet_seagrass_polygons - polygon dataset showing interpolated percentage cover of seagrass with species information (where available). This record provides access to the initial WA DoW surveys. See associated DWER records in Data WA catalogue for access to newer surveys at this site.
-
The National Reef Monitoring Network brings together shallow reef surveys conducted around Australia into a centralised database. The IMOS National Reef Monitoring Network sub-Facility collates, cleans, stores and makes this data rapidly available from contributors including: Reef Life Survey, Parks Australia, Department of Biodiversity, Conservation and Attractions (Western Australia), Department of Environment, Water and Natural Resources (South Australia), Department of Primary Industries (New South Wales), Tasmanian Parks and Wildlife Service and Parks Victoria. The data provided by the National Reef Monitoring Network contributes to establishing and supporting national marine baselines, and assisting with the management of Commonwealth and State marine reserves. Reef Life Survey (RLS) and the Australian Temperate Reef Network (ATRC) aims to improve biodiversity conservation and the sustainable management of marine resources by coordinating surveys of rocky and coral reefs using scientific methods, with the ultimate goal to improve coastal stewardship. Our activities depend on the skills of marine scientists, experienced and motivated recreational SCUBA divers, partnerships with management agencies and university researchers, and active input from the ATRC partners and RLS Advisory Committee. RLS and ATRC data are freely available to the public for non-profit purposes, so not only managers, but also groups such as local dive clubs or schools may use these data to look at changes over time in their own local reefs. By making data freely available and through public outputs, RLS and ATRC aims to raise broader community awareness of the status of Australia’s marine biodiversity and associated conservation issues.
-
Observational data for the Kelp Ecosystem Ecology Network. These data come from transects of rocky reefs taken around the world using the KEEN observational data protocol (see http://kelpecosystems.org for full description of methods and handbook). See “How” for methods. Briefly, the observational data consists of the following components, all included here: site information, fish observations, quadrat sampling, band transect sampling, percent cover from uniform point counts, and kelp morphometrics. Data Files Data files included and what they contain are as follows: keen_sites.csv - Physical and locational data for all KEEN sites and transect. keen_cover.csv - Percent cover of sessile algae and invertebrates. keen_fish.csv - Counts of fish by size class along a transect. keen_quads.csv - Counts of common algae, sessile invertebrates, and demersal fish that can be individuated. keen_swath.csv - Counts of rarer algae, sessile invertebrates, and demersal fish that can be individuated. Data Use To use the observational data here for published work we ask that 1) You contact the network coordinator, jarrett.byrnes@umb.edu, and notify them of your intention so that we can coordinate among any ongoing projects using the same data, 2) if the data has not been used in a publication in the literature before, we request that you reach out to the PIs responsible for the data you will be using and engage in a conversation about co-authorship, 3) if it has been used previously, merely cite the datasets associated with each PI that you use. The references are listed below. For access to the entire data cleaning and processing pipeline, see https://github.com/kelpecosystems/observational_data. For access to scans of the original data sheets, contact jarrett.byrnes@umb.edu. ------------------------------------------------------ For general methods: Byrnes, Jarrett E.K., Haupt, Alison J., Reed, Daniel C., Wernberg, Thomas., Pérez-Matus, Alejandro., Shears, Nick T., Konar, Brenda, Gagnon, Pat, and Vergés, Adriana. 2014. Kelp Ecosystem Ecology Network Monitoring Handbook. Kelp Ecosystem Ecology Network. For specific data sets, use the following, but also include date the data is accessed from this record in order to track the data version used. Byrnes, Jarrett E.K., Haupt, Alison J., Lyman, Ted. 2014. Kelp forest communities at Appledore Island, the Boston Harbor Islands, and Salem Sound. Kelp Ecosystem Ecology Network. Dijkstra, Jennifer A., Mello, Kristen. 2015. Kelp forest communities at York, Maine. Kelp Ecosystem Ecology Network. Grabwoski, Jonathan and MacMahan, Marissa. 2015. Kelp forest communities in Nahant, Massachusetts, and Pemaquid, Maine. Kelp Ecosystem Ecology Network. Humphries Austin T., Paight C, Ben-Horin Tal, Green Lindsay, Thornber, Carol. 2016. Kelp forest communities in Narragansett Bay, Rhode Island. Kelp Ecosystem Ecology Network. Rasher, Douglass and Price, Nicole. 2017. Kelp forest communities of central and downeast Maine. Kelp Ecosystem Ecology Network. Peréz-Matus, Alejandro and Shaughnessy, Brianna. 2017. Kelp forest communities of central and northern Chile. Kelp Ecosystem Ecology Network.
-

An object based image analysis approach (OBIA) was used to create a habitat map of Lizard Island reef, Queensland. Georeferenced dive and snorkel photo-transect surveys were conducted at different locations surrounding Lizard Island. Dominant benthic or substrate cover type was assigned to each photo by placing 24 points random over each image. Each point was then assigned a dominant cover type using a benthic cover type classification scheme containing nine first-level categories - seagrass high (>=70%), seagrass moderate (40-70%), seagrass low (<= 30%), coral, reef matrix, algae, rubble, rock and sand. The OBIA class assignment followed a hierarchical assignment based on membership rules with levels for "reef", "geomorphic zone" and "benthic community" (above). This record contains a snapshot of the data taken for use in Seamap Australia (a national benthic habitat map; https://seamapaustralia.org). View the original record at: https://doi.pangaea.de/10.1594/PANGAEA.864209
-

In 2014, UniDive (The University of Queensland Underwater Club) conducted an ecological assessment of the Point Lookout Dive sites for comparison with similar surveys conducted in 2001 - the PLEA project. Involvement in the project was voluntary. Members of UniDive who were marine experts conducted training for other club members who had no, or limited, experience in identifying marine organisms and mapping habitats. Since the 2001 detailed baseline study, no similar seasonal survey has been conducted. The 2014 data is particularly important given that numerous changes have taken place in relation to the management of, and potential impacts on, these reef sites. In 2009, Moreton Bay Marine Park was re-zoned, and Flat Rock was converted to a marine national park zone (Green zone) with no fishing or anchoring. In 2012, four permanent moorings were installed at Flat Rock. Additionally, the entire area was exposed to the potential effects of the 2011 and 2013 Queensland floods, including flood plumes which carried large quantities of sediment into Moreton Bay and surrounding waters. The population of South East Queensland has increased from 2.49 million in 2001 to 3.18 million in 2011 (BITRE, 2013). This rapidly expanding coastal population has increased the frequency and intensity of both commercial and recreational activities around Point Lookout dive sites (EPA 2008). Habitats were mapped using a combination of towed GPS photo transects, aerial photography and expert knowledge. This data provides georeferenced information regarding the major features of each of the Point Lookout Dive Sites.
-
This global meta-analysis documents data from underwater visual surveys used to determine the effect of kelp bed disturbance and canopy density on the abundance and structure of fish communities. Spatial, temporal and ontogenetic variability of many key fish species was examined at various levels of kelp disturbance at sites spanning a global temperate distribution. Rocky reef habitats and fisheries management regimes of sites were also examined as covariates.
-

[This data has been superseded by a synthesised global dataset which includes additional ecological data contributed by non-RLS entities (National Reef Monitoring Network). Please visit the corresponding NRMN Collection (IMOS - National Reef Monitoring Network Sub-Facility - Global off-transect species observations || Global reef fish abundance and biomass) for the most current version of this data. See "Downloads and Links" section below.] This dataset contains records of bony fishes and elasmobranchs collected by Reef Life Survey (RLS) divers along 50m transects on shallow rocky and coral reefs, worldwide. Abundance information is available for all records found within quantitative survey limits (50 x 5 m swathes during a single swim either side of the transect line, each distinguished as a Block), and out-of-survey records are identified as presence-only (Method 0). Although surveys are undertaken as part of monitoring programs at particular locations (mostly in Australia), this dataset contains does not include repeat surveys of sites. This data has been superseded by the NRMN collections "IMOS - National Reef Monitoring Network - Global reef fish abundance and biomass" (http://catalogue-imos.aodn.org.au/geonetwork/srv/eng/catalog.search#/metadata/b273fafa-03d6-4fc2-9acf-39d8c06581e5) and "IMOS - National Reef Monitoring Network - Global off-transect species observations" (http://catalogue-imos.aodn.org.au/geonetwork/srv/eng/catalog.search#/metadata/a73907b7-3686-4dcf-8a1d-7efc4e5ffc05).
-

This record describes data collected for the 2013 report "Synthesis of seagrass mapping studies conducted by the Water Science Branch of the Department of Water", and collected more recently by the Department of Water and Environmental Regulation ongoing monitoring. This project record provides linkage to each of metadata records describing seagrass data collected from the 11 study areas: Beaufort Inlet (2009), Hardy Inlet (2008), Irwin Inlet (2009), Leschenault Estuary (2009), Oyster Harbour (1988, 1996, 2006), Princess Royal Harbour (1996, 2006) Stokes Inlet (2009), Swan Canning (2011), Walpole Nornalup Inlets (2009), Wellstead Estuary (2009), Wilson Inlet (2007, 2008). Additional monitoring data is available from the WA DWER seagrass group via https://data.wa.gov.au for the following study areas: Leschenault Estuary (2014-2023), Peel Harvey Estuary (2021), Hardy Inlet (2018, 2020, 2023), Wilson Inlet (2017-2022), Wilson Inlet (2017-2022), Oyster Harbour (2019, 2021), Princess Royal Harbour (2021). To access the source datasets from the 2013 Synthesis for each study site/sampling occasion in their original (unaggregated) form, see child records linked to this parent record.