 IMAS Metadata Catalogue
2022
Type of resources
Topics
Keywords
Contact for the resource
Provided by
Years
-
Biological ocean data collected from ships find reuse in aggregations of historical data. These data are heavily relied upon to document long term change, validate satellite algorithms for ocean biology and are useful in assessing the performance of autonomous platforms and biogeochemical models. There is a need to combine subsurface biological and physical data into one aggregate data product to support reproducible research. Existing aggregate products are dissimilar in source data, have largely been isolated to the surface ocean and most omit physical data. These products cannot easily be used to explore subsurface bio-physical relationships. We present the first version of a biological ocean data reformatting effort (BIO-MATE, https://gitlab.com/KBaldry/BIO-MATE). BIO-MATE uses R software that reformats openly sourced published datasets from oceanographic voyages. These reformatted biological and physical data from underway sensors, profiling sensors and pigments analysis are stored in an interoperable and reproducible BIO-MATE data product for easy access and use.
-
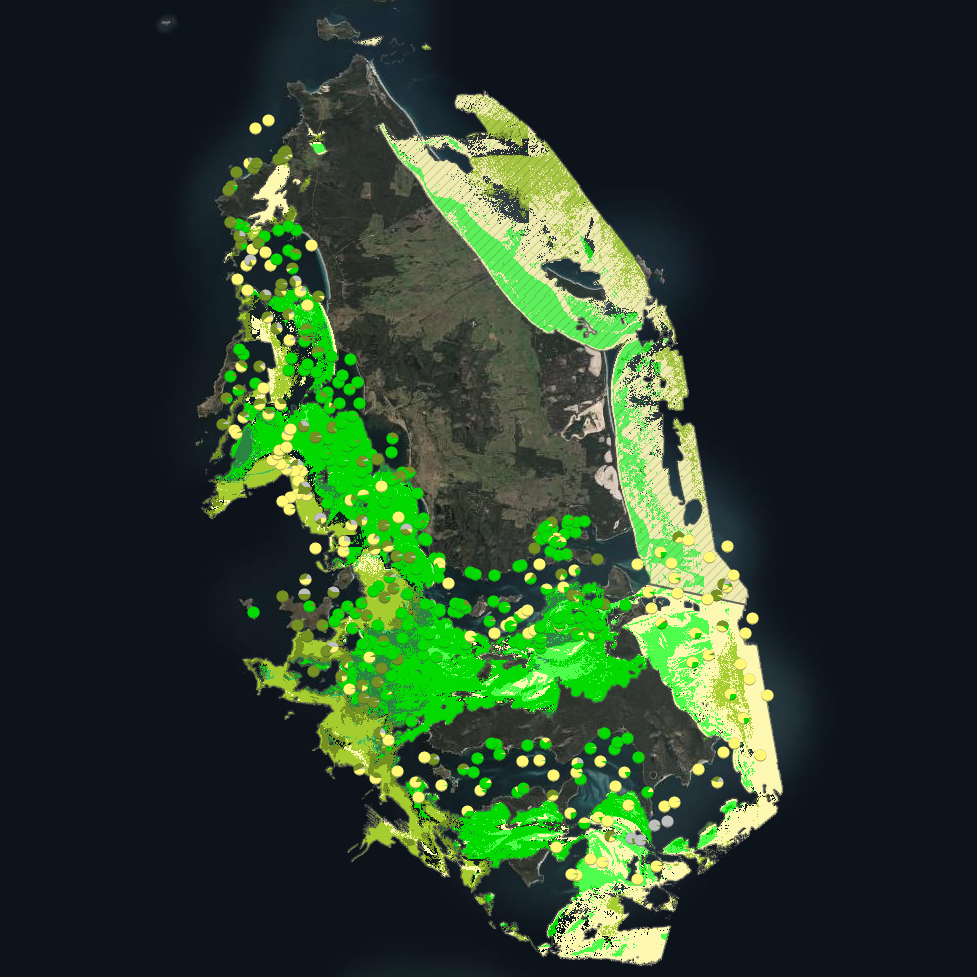
***This record contains a subset of benthic habitat data from https://doi.org/10.25959/E4S6-GE74 (NESP MaC Project 3.6) rehosted for the purposes of the Seamap Australia collaborative project.*** Seagrass beds are a dominant marine ecosystem of Tayaritja (the Furneaux Group of Islands) in the north-eastern waters off Tasmania. Historical coarse mapping has indicated extensive beds of Posidonia, Amphibolis, Heterozostera, and Zostera species, potentially comprising some of the largest and deepest seagrass extents found in temperate Australian waters. However, limited data on the distribution and ecological value of these seagrass habitats represents a significant knowledge gap in understanding Australia's wetland natural assets. This project mapped the extent, ecological composition, population structure, and blue carbon value of seagrass beds around Tayaritja, in partnership with the Tasmanian Aboriginal Centre, as part of NESP Marine and Coastal Hub Project 3.6. The study area focused on the coastal waters surrounding Flinders Island in the western Furneaux Group, with mapping extending from the high tide line to the depth limit of reliable optical detection (approximately 30 m), based on analysis of field data and satellite imagery capabilities in the region. This metadata record specifically describes the benthic mapping component of the study. A combination of close-range remote sensing methods was used to map the extent and ecological values of seagrass beds. High-resolution satellite imagery from Sentinel-2 (10 m) sensors, combined with bathymetric LiDAR data and oceanographic variables, was used to map baseline seagrass extent and composition. A field campaign deployed a Benthic Observation Survey System (BOSS) and unBaited Remote Underwater stereo-Video system (stereo-uBRUV) at approximately 400 locations to validate remote sensing outputs, collecting field photo quadrats and rhizome cores. From these data, maps were produced showing the extent and coverage of seagrass, sand, and macroalgae, and where possible, seagrass species composition, subject to water depth and clarity constraints. See the "Lineage" section of this record for full methodology.
-
Efforts to restore Posidonia seagrass meadows in NSW are reliant on collecting beachcast fragments as collection of donor material from extant beds is prohibited. However, to maximise the collection efforts it necessary to understand where to collect fragments from and what environmental conditions (e.g. wind direction, wind strength, tidal height) increase the availability of fragments and where to collect the most healthy fragments. This data set captures the abundance of fragments at 7 sites in Gamay (Botany Bay), an area of interest for restoration of Posidonia australis. It investigates how characteristics of wind (speed and direction), tidal height and swell (height, direction) influence the availability (abundance) and health (as determined by observations of necrosis) of shoots at sites throughout Botany Bay. The Excel data workbook is comprised of two sheets: Fragments_data sheet shows the number of P. australis fragments collected at different sites, when they were collected, and the environmental conditions at collection (see data attributes section). Shoot_data sheet shows the proportion of necrosis of shoots attached to collected fragments.
-
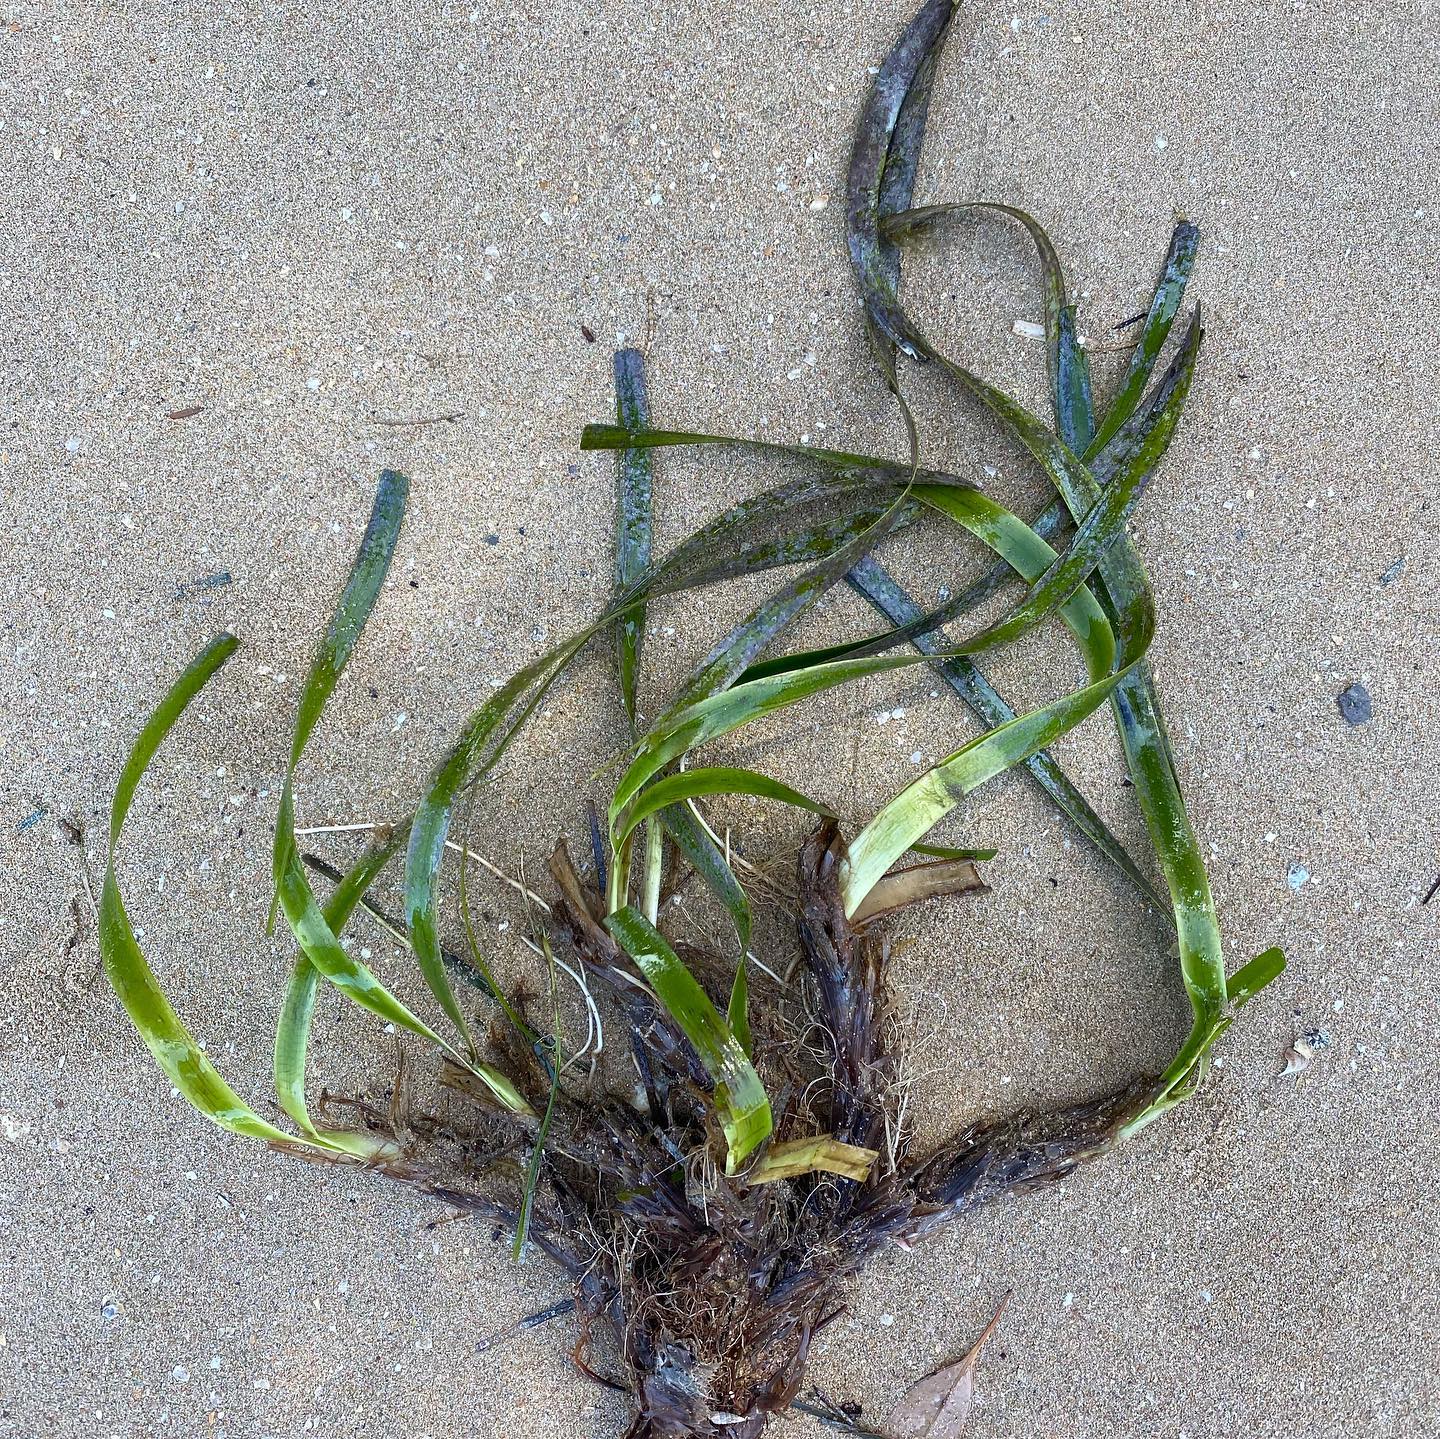
Out-of-range observations of significant rafts of giant kelp (Macrocystis pyrifera) washing ashore in southern NSW in winter 2020. On 9 August 2020, two local marine naturalists on the south coast of New South Wales, Australia noticed a significant amount of a large unfamiliar kelp washed up on a local beach. Following some quick confirmations via phone and email, it was revealed that the unfamiliar seaweed was giant kelp (Macrocystis pyrifera): a species whose closest known populations are ~450 km away to the south (in Tasmania and western Victoria) and whose transport to New South Wales would have required oceanic rafting over several weeks and hundreds of kilometres against the prevailing south-flowing East Australian Current. Subsequent community-led searches over the following days confirmed four more locations of often-substantial amounts of giant kelp wrack, as well as many more anecdotal and unconfirmed accounts.
-
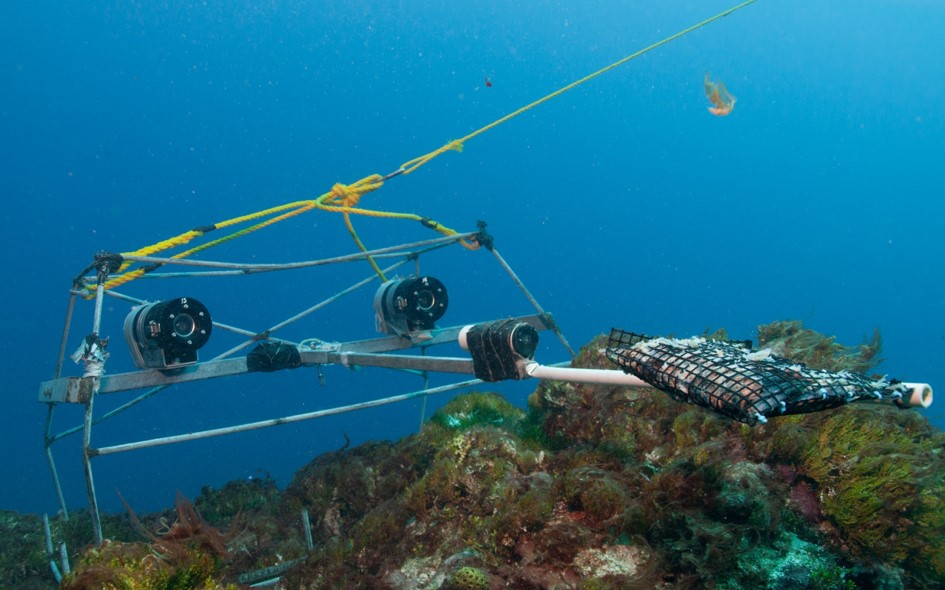
Benthic habitat annotations of stereo Baited Remote Underwater Video (Stereo-BRUV) and panoramic drop camera imagery, were completed as part of a report funded by the NESP Marine & Coastal Hub. This report focussed on an IUCN II zone in the South-west Corner Marine Park off the 'Capes region' near Margaret River. These data were analysed in TransectMeasure using a modified version of the CATAMI scheme.
-
The recruitment of mussels and microphytobenthic (MPB) algae to 28 experimental artificial reefs supporting different patch sizes and density of kelp (Ecklonia radiata) off Maria Island, Tasmania. The recruitment of mussels was assessed using rope fibre habitats, and the recruitment of MPB algae was assessed using microscope slides, positioned across the artificial reef and collected in November 2015. These data were collected to examine how the patch size and density of kelp influences the establishment of MPB algae and mussels.
-
Seagrass meadow extent and meadow-scape was mapped using three alternative approaches at Midge Point, a coastal turbid water habitat, in the central section of the Great Barrier Reef, in September/October 2017. Approach 1 included mapping meadow boundaries and meadow-scape during low spring tides on foot using a handheld Garmin GPS. Approach 2 was where the meadows were surveyed at low tide with observations from a helicopter, with observational spot-checks conducted at a number haphazardly scattered points. Approach 3 used PlanetScope Dove imagery captured on 09 October 2017 coinciding as close as possible to the field-surveys, with 3.7 m x 3.7 m pixels (nadir viewing) acquired from the PlanetScope archive. This record describes meadow extent data collected using Approach 3 (PlanetScope imagery). View the original metadata record at https://doi.org/10.1594/PANGAEA.946606 for the full data collection.
-
The data describes number of vessels, engine power, gross tonnage and fishing effort by year (1950-2017), targeted functional group, and fishing gear. Fishing effort estimates were derived from country-level fishing fleet capacity data publicly available, following the method described in Rousseau et al (2019; https://doi.org/10.1073/pnas.1820344116) and methods improvement reported in Rousseau et al. (in prep). The data coverage is global, but estimates are given at the Exclusive Economic Zone-, Large Marine Ecosystem-, and Food Agriculture Organisation-level. The data was collected for a wide range of uses, including to inform global and regional marine ecosystem models and to understand the long-term evolution of fishing and its socio-ecological implications in the global ocean.
-
The effect of ocean alkalinity enhancement on a coastal phytoplankton community was assessed via a microcosm experiment. The effect of alkalinity enhancement in two scenarios (i) when enclosed seawater was in equilibrium with atmospheric CO2 and (ii) when enclosed seawater was not in equilibrium with atmospheric CO2 were explored. Alkalinity was increased by ~497 umol/kg in these two treatments and plankton communities, carbonate chemistry, dissolved inorganic nutrients, particulate matter and chlorophyll a dynamics monitored over a 22 day period where a spring bloom occurred.
-
Data collected from Southern Ocean phytoplankton laboratory culture experiments to examine the effect of iron limitation on the Chlorophyll fluorescence (F) to chlorophyll (Chl) ratio. Irradiance levels at which cultures were grown are indicated by the photon flux density (PFD). Growth rates of Fe limited cultures (-Fe) relative to Fe replete cultures (+Fe) are referred to as μ / μmax (unitless).