 IMAS Metadata Catalogue
environment
Type of resources
Topics
Keywords
Contact for the resource
Provided by
Years
-
NESP Marine Biodiversity Hub Project C2 involved integration and analysis of three existing monitoring datasets: the Reef Life Survey (RLS), IMAS Long-term MPA (LTMPA), and AIMS Long-term (AIMS LTM) monitoring programs. These analyses involved generating new derived data on indicator values for survey sites in each of the datasets, which have been reported in the 2016 State of the Environment (SoE) report. Indicators included the biomass of large fishes, the community temperature index, the proportion of invasive species, crown-of-thorns seastar density and the proportion of threatened species. Details of calculation of these indicators and summary of trends in values across sites and times are provided in detail in a manuscript currently in the review process for an international journal [RSS to provide publication details once available], as well as in metadata supplied for the State of the Environment report. This metadata record provides links to each of the three datasets used in the synthesis, and links to access the derived biological indicator data reported in the 2016 SoE report. See "On-Line Resources" section.
-
The movement and behaviour of the Southern Rock Lobster (Jasus edwardsii) was monitored using a radio acoustic telemetry systems at two sites in eastern Tasmania.
-
This dataset summarises 40 years of seagrass data collection (1983-2022) within Torres Strait and the Gulf of Carpentaria. The full dataset is available through eAtlas at https://doi.org/10.26274/2CR2-JK51 and contains point and polygon packages. This record describes the meadow extent polygons at 641 individual or composite meadows. Managing seagrass resources in northern Australia requires adequate baseline information on where seagrass is (presence/absence), the mapped extent of meadows, what species are present, and date of collection. This baseline is particularly important as a reference point against which to compare seagrass loss or change through time. The scale of northern Australia and the remoteness of many seagrass meadows from human populations present a challenge for research and management agencies reporting on the state of seagrass ecological indicators. Broad-scale and repeated surveys/studies of areas are logistically and financially impractical. However seagrass data is being collected through various projects which, although designed for specific reasons, are amenable to collating a picture of the extent and state of the seagrass resource. In this project we compiled seagrass spatial data collected during surveys in Torres Strait and the Gulf of Carpentaria into a standardised form with point-specific and meadow-specific spatial and temporal information. We revisited, evaluated, simplified, standardised, and corrected individual records, including those collected several decades ago by drawing on the knowledge of one of our authors (RG Coles) who led the early seagrass data collection and mapping programs. We also incorporate new data, such as from photo records of an aerial assessment of mangroves in the Gulf of Carpentaria in 2017. This project was funded by the National Environmental Science Programme (NESP) Marine and Coastal Hub and Torres Strait Regional Authority (TSRA) in partnership with the Centre for Tropical Water and Aquatic Ecosystem Research (TropWATER), James Cook University. The project follows on from TropWATER’s previous work compiling 35 years of seagrass spatial point data and 30 years of seagrass meadow extent data for the Great Barrier Reef World Heritage Area (GBRWHA) and adjacent estuaries, funded through successive NESP Tropical Water Quality Hub Projects 3.1 (2015-2016) and 5.4 (2018-2020). These data sets are now publicly available through the eAtlas data portal: https://doi.org/10.25909/y1yk-9w85 . In making this data publicly available for management, the authors and data custodians request being contacted and involved in decision making processes that incorporate this data, to ensure its limitations are fully understood. Polygons in the meadow layer are drawn from extent data collected during some surveys. Not all surveys collected meadow extent data (e.g., Torres Strait lobster surveys). The seagrass meadow layer is a composite of all the spatial polygon data we could access where meadow boundaries were mapped as part of the survey. All spatial layers were compiled into a single spatial layer using the ArcToolbox ‘merge’ function in ArcMap. Where the same meadow was surveyed multiple times as part of a long-term monitoring program, the overlapping polygons were compiled into a single polygon using the ‘merge’ function in ArcMap. Because meadows surveyed more than once were merged, there were some cases where adjacent polygons overlap each other. Meadow Data Includes: 1. Temporal survey details – Survey month and year, or a list of survey dates for meadows repeatedly sampled; 2. Survey methods; 3. Meadow persistence – Classified into three categories: a. Unknown – Unknown persistence as the meadow was surveyed less than five times; b. Enduring – Seagrass is present in the meadow ≥90% of the surveys; c. Transitory – Seagrass is present in the meadow <90% of the surveys; 4. Meadow depth – Classified into three categories: a. Intertidal – Meadow was mapped on an exposed bank during low tide, e.g. Karumba monitoring meadow; b. Subtidal – Meadow remains completely submerged during spring low tides, e.g. Dugong Sanctuary meadow; c. Intertidal-Subtidal – Meadow includes sections that expose during low tide and sections that remain completely submerged, e.g. meadows adjacent to the Thursday Island shipping channel; 5. Dominant species of the meadow based on the most recent survey; 6. Presence or absence of individual seagrass species in a meadow; 7. Meadow density categories – Seagrass meadows were classified as light, moderate, dense, variable or unknown based on the consistency of mean above-ground biomass of the dominant species among all surveys, or percent cover of all species combined (see Table 2 in Carter et al. 2022). For example, a Halophila ovalis dominated meadow would be classed as “light” if the mean meadow biomass was always <1 gram dry weight m-2 (g DW m-2) among years, “variable” if mean meadow biomass ranged from <1 - >5 g DW m-2, and “dense” if mean meadow biomass was always >5 g DW m-2 among years. For meadows with density assessments based on both percent cover (generally from older surveys) and biomass, we assessed density categories based on the biomass data as this made the assessment comparable to a greater number of meadows, and comparable to the most recent data. Meadows with only one year of data were assigned a density category based on that year but no assessment of variability could be made and these are classified as “unknown”; 8. The minimum and maximum annual mean above-ground biomass measured in g DW m-2 (+ standard error if available) for each meadow is included for meadows with >1 year of biomass data. For meadows that were only surveyed once the mean meadow biomass (+ standard error if available) is presented as the minimum and maximum biomass of the meadow. “-9999” represents meadows where no above-ground biomass data was collected.; 9. The minimum and maximum annual mean percent cover is included for each meadow with >1 year of percent cover data. For meadows that were only surveyed once the mean meadow percent cover is presented as the minimum and maximum percent cover of the meadow. Older surveys (e.g., 1986 Gulf of Carpentaria surveys) used percent cover rather than biomass. For some surveys percent cover was estimated as discrete categories or ‘data binning’ (e.g., <10% - >50%). “-9999” represents meadows where no percent cover data was collected; 10. Meadow area survey details – The minimum, maximum and total area (hectares; ha) for each meadow: a. Total area - Total area of each meadow was estimated in the GDA 1994 Geoscience Australia Lambert projection using the ‘calculate geometry’ function in ArcMap. For meadows that were mapped multiple times, meadow area represents the merged maximum extent for all surveys. 11. Minimum and maximum area – For meadows surveyed more than once the minimum and maximum annual area of the meadow was reported. For meadows that were only surveyed once the meadow area is presented as the minimum and maximum area of the meadow. Where possible, we retained area data reported in the original shapefiles (and calculated using original projections). Where area data did not exist in original shapefiles (e.g., 1986 Gulf of Carpentaria surveys), we calculated area using the ‘calculate geometry’ function in ArcMap in the GDA 1994 Geoscience Australia Lambert projection; Data custodians. Spatial Limits: Data was limited to that collected in the Gulf of Carpentaria between Cape Arnhem (Northern Territory) and Cape York (Queensland). Torres Strait data was restricted to north of Queensland’s Great Barrier Reef World Heritage Area boundary, and includes data collected along the Papua New Guinea coastline. Taxonomy: Seagrass taxonomic revision over the last couple of decades has resulted in the revision and reclassification of some tropical species. For example, Zostera capricorni has been reclassified as Zostera muelleri subsp. capricorni, Halophila minor a synonym of Halophila ovalis, and Halodule pinifolia a synonym of Halodule uninervis. Field surveys have at times grouped species that are difficult to distinguish in the field. To address these issues, we amalgamated some species into complexes: Halophila minor and Halophila ovalis are included as Halophila ovalis complex. Zostera muelleri subsp. capricorni has been abbreviated to Zostera capricorni throughout for simplicity. Data Sets: Data was limited to that collected in the Gulf of Carpentaria between Cape Arnhem (Northern Territory) and Cape York (Queensland). Torres Strait data was restricted to north of Queensland’s Great Barrier Reef World Heritage Area boundary, and includes data collected along the Papua New Guinea coastline. Further information in the data sets included in this synthesis can be found in this report: Carter A, McKenna S, Rasheed M, Taylor H, van de Wetering C, Chartrand K, Reason C, Collier C, Shepherd L, Mellors J, McKenzie L, Roelofs A, Smit N, Groom R, Barrett D, Evans S, Pitcher R, Murphy N, Duke NC, Carlisle M, David M, Lui S, Torres Strait Indigenous Rangers (led by Pearson L, Laza T, Bon A), and Coles RG (2022). Four Decades of Seagrass Spatial Data from Torres Strait and Gulf of Carpentaria. Report to the National Environmental Science Program. Centre for Tropical Water and Aquatic Ecosystem Research (TropWATER), James Cook University. Limitations of the Data: Data included extends back to the mid-1980s. Large parts of the coast have not been mapped for seagrass presence since that time. Technology and methods for mapping and position fixing have improved dramatically in 40 years. This layer represents the most reliable interpretation of that early data. Not all surveys collected meadow data, including Torres Strait lobster and beche de mer surveys and Torres Strait intertidal transect monitoring collected only site data. Because of this, the meadow layer represents an underestimate of seagrass extent, particularly in deeper subtidal waters. The meadow layer should be used in conjunction with the site layer to determine where meadows have been mapped, and where seagrass surveys have occurred but no seagrass has been found. See Table 1 and Data age, Limitations and Variability section in Carter et al. (2022). Data Dictionary: Torres Strait and Gulf of Carpentaria seagrass meadows, 1984-2022 (polygon data) - ID (numeric) - Unique identifier representing a single meadow - SURVEY_NAME (text) – Name of survey location - SURVEY_DATE (text) – A list of survey date(s) for meadows repeatedly sampled; month and year - PERSISTENCE (text) – Meadow form on three categories: enduring, transitory, unknown - DEPTH (text) – Classified into three categories (intertidal, subtidal, intertidal-subtidal) - DENSITY (text) – Meadow density categories (light, moderate, dense, variable, unknown) - AREA (text) - Area of the composite meadow in a given location in hectares, represents merged maximum extent - SURVEY METHOD (text) – e.g., helicopter, walking, hovercraft, boat-based including camera, free diving, scuba diving, van Veen grab, sled net - COMMENTS (text) – Any comments for that site - CUSTODIAN (text) – Custodian/owner of the data set - NO_SURVEYS (numeric) – Number of times meadow has been surveyed - DOMINANT_SPP [DOM_SPP] (text) – The dominant species in the meadow - EA_PA (numeric) – Absence (0) or Presence (1) of Enhalus acoroides - TC_PA (numeric) – Absence (0) or Presence (1) of Thalassodendron ciliatum - TH_PA (numeric) – Absence (0) or Presence (1) of Thalassia hemprichii - CS_PA (numeric) – Absence (0) or Presence (1) of Cymodocea serrulata - CR_PA (numeric) – Absence (0) or Presence (1) of Cymodocea rotundata - ZC_PA (numeric) – Absence (0) or Presence (1) of Zostera muelleri subsp. capricorni - HU_PA (numeric) – Absence (0) or Presence (1) of Halodule uninervis - SI_PA (numeric) – Absence (0) or Presence (1) of Syringodium isoetifolium - HS_PA (numeric) – Absence (0) or Presence (1) of Halophila spinulosa - HT_PA (numeric) – Absence (0) or Presence (1) of Halophila tricostata - HO_PA (numeric) – Absence (0) or Presence (1) of Halophila ovalis - HC_PA (numeric) – Absence (0) or Presence (1) of Halophila capricorni - HD_PA (numeric) – Absence (0) or Presence (1) of Halophila decipiens - BIO_MIN (numeric) – The minimum mean meadow biomass measured in g DW m-2 for meadows sampled more than once, or -9999 where biomass data not recorded - BIO_MIN_SE (numeric) – Standard error of the minimum mean meadow biomass measured in g DW m-2, or -9999 where biomass data not recorded - BIO_MAX (numeric) – The maximum mean meadow biomass measured in g DW m-2 for meadows sampled more than once, or -9999 where biomass data not recorded - BIO_MAX_SE (numeric) – Standard error of the maximum mean meadow biomass measured in g DW m-2, or -9999 where biomass data not recorded - PER_CO_MIN (numeric) – The minimum mean meadow percent cover for meadows sampled more than once, or -9999 where percent cover data not recorded - PER_CO_MAX (numeric) – The maximum meadow percent cover for meadows sampled more than once, or -9999 where percent cover data not recorded - AREA_MIN (numeric) – The minimum area for meadows sampled more than once - AREA_MAX (numeric) – The maximum area for meadows sampled more than once
-
Investigations of the impact of sewage and heavy metal inputs on inshore rocky reef communities have been limited to date because the scale of information on levels of pollutants has been much broader than the span of transects at sites investigated. As a consequence, analyses have been confounded by poor information on the variety of stressors operating at any site. Finer resolution data on pollutants are needed. To address this deficiency, the influence of sewage, heavy metals and other pollutants were assessed by collecting sediment samples at Reef Life Survey ecological monitoring sites and measuring a range of associated markers. This includes basic biogeochemical information (pH, turbidity, total phosphate, TKN, total organic carbon), stable isotopes (delta15N, delta13C), heavy metal concentrations, hydrocarbon concentrations.
-

This record provides an overview of the NESP Marine and Coastal Hub small-scale study - "Microplastics in South Eastern Australian coastal waters: synthesising current data and identifying key knowledge gaps for the management of plastic pollution". For specific data outputs from this project, please see child records associated with this metadata. -------------------- Plastic pollution is pervasive in coastal environments globally and in Australia. Due to their small size, microplastics (pieces <5mm) are readily ingested by marine organisms and potentially accumulate across food webs, raising concerns for biota, ecosystem services and human health. Yet, to define guidelines and support policy actions that curb microplastic pollution, managers and decision-makers lack clear, synthesised information on this multifaceted issue, including on occurrence, sources, and pathways of microplastics in coastal and marine environments. This project synthesised current knowledge on microplastics in the coastal waters of South-Eastern Australia (South Australia, Victoria, and New South Wales), identifying key gaps in data, monitoring, and risk assessment. A central output was a compiled database of existing microplastics studies across the study region. Through engagement with stakeholders from government, research, and industry, the project defined shared priorities and barriers to action. Three critical research needs were identified: (1) methodological harmonisation, (2) source and pathway identification, and (3) evidence of ecological risk. Together, the synthesis and stakeholder input set a clear direction for future coordinated research to enable evidence-based management of microplastic pollution across jurisdictions. The work laid the foundation for the development of a Standard Operating Procedure (SOP) for marine microplastics sampling, which was subsequently delivered through NESP Marine and Coastal Hub Project 2.2 (https://www.nespmarinecoastal.edu.au/project/2-2): chapter "Marine sampling field manual for microplastics" in Field Manuals for Marine Sampling to Monitor Australian Waters, Version 3 (https://microplastics-field-manual.github.io). Outputs • Inventory of compiled datasets relating to microplastics in SE Aus waters [spatial dataset] • Final Project Report synthesising the information available on the presence of microplastics in coastal marine environments in South Eastern Australia, its potential sources and pathways [written]
-
Temperature loggers have been deployed at a range of sites statewide in waters ranging between 6 and 22m depth. From 2012, 29 sites around Tasmania are being monitored. This record shows data collected from 2004 up to March 2025. Data is still being collected (July 2025) and will be added to this collection as it becomes available.
-
Collected benthic community structure (species and abundance) and physical/chemical attributes (including sediment grain size, redox, sulphide and depth) for a large number of locations in the Huon and Derwent estuaries of south east Tasmania. Data was collected using van veen grab, divers where necessary or core samples. All locations include heavy metal data and site information. Most data was collected with spatial references (GPS).
-
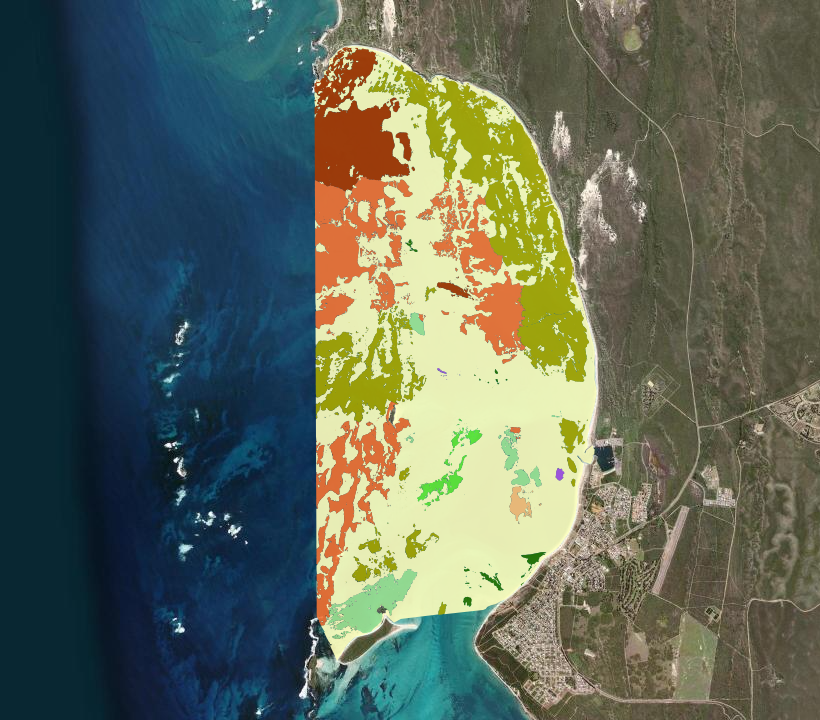
Jurien Bay Boat Harbour is located north of the town of Jurien Bay, ~250 km north of Perth, Western Australia. The Boat Harbour services a range of government, recreational and commercial vessels and is managed by the WA Department of Transport (DoT). Wrack and marine sediments frequently accumulate in the Boat Harbour, negatively affecting the navigability, environment and aesthetic quality of the Harbour. To manage these impacts, routine maintenance dredging is undertaken by DoT. To inform future dredging requirements and marine environmental management of the Boat Harbour, BMT undertook benthic habitat mapping of Jurien Bay in November 2017 on behalf of DoT. The objectives of the mapping project were to: i. collect baseline data on the spatial extent and characteristics of benthic habitats in the mapping area, and ii. qualitatively characterise the extent of benthic primary producer habitat surrounding the Boat Harbour, and develop a mapping product to inform dredging operations and potential future environmental approvals applications, if necessary. Mapping was conducted by first collating satellite imagery to identify benthic habitat features to be ground-truthed by towed video. Video footage was annotated with biological attributes and combined with the satellite imagery to create classified benthic habitat maps of an area offshore of the Boat Harbour. See the "Lineage" section of this record and attached survey report for detailed methodology.
-
This project generated a set of high-quality eDNA-based biodiversity datasets from samples collected at broadly distributed offshore sites across Southeast Australia. The data consists of processed data from eDNA metabarcoding assays (i.e. tables with sampling information, sequence read counts and taxonomy derived from the sequences). Raw sequence data (over 180 million sequences) is available from NCBI (https://www.ncbi.nlm.nih.gov/) under BioProject PRJNA1263580: Environmental DNA measuring offshore marine biodiversity in southeast Australia (https://www.ncbi.nlm.nih.gov/bioproject/PRJNA1263580/). The eDNA biodiversity information focussed on fish but includes sequence data from the full tree of life (from bacteria to vertebrates). Part of the purpose of data collection was to assess key technical aspects of eDNA data collection to refine sampling methods and provide guidance for best practices in future offshore eDNA research
-

This record provides an overview of the NESP Marine and Coastal Hub project "Mapping temperate continental shelf seabed habitats". For specific data outputs from this project, please see child records associated with this metadata. -------------------- Rocky reefs on Australia's temperate continental shelf support diverse ecological communities, including corals, sponges, mobile invertebrates, fish, and marine mammals. These habitats underpin important natural, economic, and cultural values and are subject to pressures from fishing, shipping, and climate change. Rocky reefs are key features of many Australian Marine Parks (AMPs), and improving knowledge of their extent and condition is essential for effective management and evaluation of conservation outcomes - particularly in offshore areas where seafloor habitat data is limited. This project addressed knowledge gaps on the extent and distribution of seabed habitats by focusing on rocky reef systems within the South-west and South-east Marine Parks Networks. It built on previous research from the NESP Marine Biodiversity Hub by collating and analysing existing seafloor data, and deploying drop cameras at priority sites (selected in consultation with Parks Australia and other end-users) to validate seafloor habitat extent and type. This new survey data was incorporated with newly developed data workflows to generate ecosystem models of reef and soft sediments, and broad-scale ecosystem classes - with a focus on workflows enabling rapid update of products and ensuring consistency across mapping outputs. These data products directly support NESP Marine and Coastal Hub Project 2.3 (Improving knowledge transfer for AMP management). The project team worked with Indigenous Rangers and organisations in the South-west region to identify opportunities for collaboration, incorporate cultural knowledge into research design, and support knowledge exchange through field-based activities and on-country engagement. The project aimed to strengthen both established and emerging relationships, building on existing collaborations between University of Western Australia (UWA) researchers and the Esperance Tjaltjraak Native Title Aboriginal Corporation (ETNTAC) on complementary projects. UWA had also previously partnered with the South West Aboriginal Land and Sea Council (SWALSC), in consultation with the South West Boojarah (now Karri Karrak) and the Undalup Association, to support cultural mapping and biodiversity surveys under the NESP Marine Biodiversity Hub. These partnerships informed the project’s cultural engagement approach and laid the groundwork for ongoing collaboration. Outcomes of this work included improved capacity for AMP managers to identify and monitor rocky reef habitats and key natural values, assess management effectiveness, and support initiatives such as marine spatial planning and ecosystem-based fisheries management, and contribute to emerging frameworks such as ocean accounting. It also helped to guide the targeting of future surveys, particularly in ecosystems with high conservation value. Outputs • Seafloor imagery and annotations [dataset] • Predicted 'ecosystem component' habitat maps for the temperate continental shelf [dataset] • Predicted reef and sediment extent map for the temperate continental shelf [dataset] • Final technical report [written]