 IMAS Metadata Catalogue
2023
Type of resources
Topics
Keywords
Contact for the resource
Provided by
Years
-
The datasets contain summaries of Queensland logbook data on catch and effort distribution for commercial fisheries in state marine and estuarine waters. The logbook data has been recorded and submitted to QLD Department of Primary Industries by commercial fishers. The data are aggregated to produce summaries of total catch and effort by fishery at a 6 nm resolution where 5 boats or more operate. For areas where less than 5 boats operate the data is shown as confidential. The data was mapped using 5 year - financial year periods; 2003/04 to 2007/08, 2008/09 to 2012/13, 2018/19 to 2022/23, and 1 year; 2022/23.
-
The datasets contain summaries of South Australian Aquaculture production by region in state marine and estuarine waters. The data was mapped using 5 year - financial year periods; 2003/04 to 2007/08, 2008/09 to 2012/13, 2018/19 to 2022/23, and 1 year; 2022/23.
-
Repeat surveys of aquatic flora were conducted in Princess Royal Harbour in 1996, 2003, 2005 and 2006. This data is part of the 2013 report "Synthesis of seagrass mapping studies" conducted by the Water Science Branch of the Department of Water. Surveys were initially conducted by the WA Department of Water. The objectives of the study were to map the distribution of the different seagrass species found in Princess Royal Harbour and Oyster Harbour and to compare the distributions with that observed in previous studies (1996 and 2003). This data was acquired by the ACEAS Seagrass Group as part of the 2013 Australia-wide risk assessment of Seagrass. Surveys were conducted again in January and March 2021 by the Department of Water and Environmental Regulation as "Princess Royal Harbour Seagrass Survey". The datasets making up the 1996-2006 Princess Royal Harbour seagrass survey data are: WA_PrincessRoyal_seagrass_polygons - polygon dataset showing interpolated percentage cover of seagrass. This record provides access to the initial WA DoW surveys. See associated DWER records in Data WA catalogue for access to newer surveys at this site.
-
Kelps are in global decline due to climate change, including ocean warming. To identify vulnerable species, we need to identify their tolerances to increasing temperatures and whether tolerances are altered by co-occurring drivers such as inorganic nutrient levels. This is particularly important for those with restricted distributions, which may already be experiencing thermal stress. To identify thermal tolerance of the range restricted kelp Lessonia corrugata, we conducted a laboratory experiment on juvenile sporophytes to measure performance (growth, photosynthesis) across its thermal range (4 – 22 °C). We found the upper thermal limit for growth and photosynthesis to be ~ 22 – 23 °C, with an optimum of ~ 16 °C. To determine if elevated inorganic nitrogen availability could enhance thermal tolerance, we compared performance of juveniles under low (4.5 µmol/day) and high (90 µmol/day) nitrate conditions at and above the thermal optimum (16 – 23.5 °C). Nitrate enrichment did not enhance thermal performance at temperatures above the optimum but did lead to elevated growth rates at the thermal optimum 16 °C. Our findings indicate L. corrugata is likely to be extremely susceptible to moderate ocean warming and marine heatwaves. Peak sea surface temperatures during summer in eastern and northeastern Tasmania can reach up to 20 – 21 °C and climate projections suggest that L. corrugata’s thermal limit will be regularly exceeded by 2050 as south-eastern Australia is a global ocean-warming hotspot. By identifying the upper thermal limit of L. corrugata we have taken a critical step in predicting the future of the species in a warming climate.
-
This record provides an overview of the NESP Marine and Coastal Hub Research Plan 2023 project 3.7 – Identifying and overcoming barriers to coastal and marine habitat restoration and Nature based Solutions in Australia. No data outputs are planned for this project. -------------------- There is an increasing need for coastal and marine restoration around Australia to help address habitat and biodiversity loss, water quality decline, invasive species impacts, and coastal inundation and erosion; and to identify blue carbon opportunities. However, broader uptake of restoration and nature-based solutions in Australia is constrained by policy and legislative barriers, limited adoption within engineering practice, and insufficient inclusion of Aboriginal and Torres Strait Islander peoples in project design and delivery. This project examined barriers and opportunities for scaling marine and coastal restoration and nature-based solutions across three themes: (1) regulatory and permitting pathways; (2) engineering sector adoption, and (3) Aboriginal and Torres Strait Islander inclusion and co-design. The approach built on earlier work through Marine and Coastal Hub Project 1.6 (https://www.nespmarinecoastal.edu.au/project/1-6/) which identified a clear need for coordinated, landscape-scale restoration and greater support for nature-based approaches. Research reviews of approval and permitting processes were conducted in Queensland, New South Wales, Tasmania and South Australia, with a focus on oyster reef restoration and tidal reintroduction for wetland restoration. Consultation was undertaken with Commonwealth and state agencies, the national Wetland and Aquatic Ecosystems Task Force, restoration practitioners, non-government organisations, engineering and environmental consultancies, and Indigenous groups involved in restoration activities. Workshop and consultation findings were translated into practical guidance and framework materials for governments, practitioners and restoration proponents. These outputs provide a basis for clearer approval pathways, greater confidence in nature-based solutions within coastal engineering, and more inclusive restoration planning with Aboriginal and Torres Strait Islander peoples. Outputs • Identifying and overcoming barriers to marine and coastal habitat restoration and nature-based solutions in Australia [project summary - written] • A blueprint for overcoming barriers to the use of nature-based coastal protection in Australia [written] • Legislative permitting processes for restoration [written] • Pathways to Aboriginal and Torres Strait Islander inclusion and co-design in restoration [written]
-
This record provides an overview of the NESP Marine and Coastal Hub project "Mapping critical Australian sea lion habitat to assess ecological value and risks to population recovery". For specific data outputs from this project, please see child records associated with this metadata. -------------------- Australian sea lion populations have declined by more than 60% over the past four decades. Abundance and trends vary markedly across the species range, suggesting that localised risk profiles from threats - such as bycatch, marine pollution, and habitat degradation - vary at small spatial scales. Fine scale variation in habitat use is thought to underpin these differences, yet knowledge about Australian sea lion's dependency on key habitats and their vulnerability to human impacts is limited. This project deployed compact animal-borne cameras with GPS and motion sensors on eight adult female sea lions at two key colonies: Seal Bay (Southern Kangaroo Island Marine Park) and Olive Island (Western Eyre Marine Park). The devices recorded nearly 80 hours of footage over 560 km of seabed, identifying six distinct benthic habitat types, including previously unmapped rocky reefs and kelp forests. The footage was used to develop fine-scale habitat maps using machine learning models, providing a valuable baseline for assessing ecological value, foraging intensity, and the effectiveness of protected areas. This innovative approach complements traditional seafloor mapping and offers a scalable, cost-effective method for locating and monitoring critical habitats for endangered marine species. The results directly inform recovery planning, fisheries management, marine park design, and the identification of Biologically Important Areas. Ongoing camera deployments at Seal Bay and new sites along the western Eyre Peninsula will improve understanding of sea lion colony-specific behaviours and contribute to long-term monitoring of habitat change, diet, and emerging threats. Outputs • Tracking data from sea lion-deployed tags: location, depth, time, temperature, light, acceleration [dataset] • Timestamped video footage from sea lion-deployed cameras [dataset] • Final project report [written]
-
Dataset collected at Cape Evans, Antarctica, November 2023 as part of a long-term NIWA benthic monitoring program under the Antarctica New Zealand event number K882A. The dataset includes multiple sea-ice and seafloor hyperspectral imaging transects (10-40 meters long) coupled with normal red, green, and blue (RGB) imagery from a dual camera machine vision system. The data were acquired using the remotely operated vehicle (ROV) HIcyBot system, funded by the Australian Centre for Excellence in Antarctic Research (ACEAS). A GNSS-integrated USBL transponder equipped onto the ROV allowed every frame of the high frequency hyperspectral imager to be timestamped via GPS clock to acoustically provided underwater position and attitude. The dataset also includes hyperspectral imaging scans of sampled/retrieved organisms found at the seafloor, to support habitat mapping algorithm development (e.g., algae, urchins, sea-stars, etc.). The ROV was tested as part of an ACEAS Program 2 subcomponent that involved the design of the new under-ice hyperspectral imaging and photogrammetric payload mounted onto the HIcyBot ROV. The overarching goal of the systems was to be able to acquire information of under the sea-ice sympagic and benthic communities (e.g., biomass and photophysiology) and deliver a multi-scale array of biophysical data that can be assimilated with known information in the region and monitor fine-scale change. Through the analysis of new and existing bio-optical under-ice data, the dataset aims to ultimately envisions the delivery of new monitoring tools and algorithms that can provide support for modelling efforts and reveal complex biophysical processes under a changing Antarctic Sea ice. ***NOTE: Data processing is still underway (April 2025). Please contact Emiliano.Cimoli@utas.edu.au for access to data.***
-
Data from multibeam echosounder surveys taken as part of the Ningaloo Outlook project were classified into various seafloor cover types according to their hardness, rugosity and depth. The classifications were validated with towed video ground truth where it was available. This dataset describes two AOIs which are explicitly part of the Ningaloo Outlook Deep Reefs project. Substratum classifications were applied using multibeam backscatter angular response curves along with rugosity as input to a maximum likelihood classifier. See original metadata record(s) and associated attached documents for accuracy estimates, alternate classification techniques, and additional surveyed areas. https://doi.org/10.25919/kssa-5b46 https://doi.org/10.25919/kttc-x397 https://doi.org/10.25919/8m65-7k26
-
This record provides an overview of the NESP Marine and Coastal Hub Research Plan 2023 project "Eastern Grey Nurse Shark population abundance and trend". For specific data outputs from this project, please see child records associated with this metadata. -------------------- Grey nurse sharks are a nationally significant threatened species, with Australia’s eastern population listed as Critically Endangered under the EPBC Act. The Recovery Plan for the Grey Nurse Shark identifies the need for robust estimates of abundance, population trend, age structure, survival and range, particularly where conservation measures such as spatial closures and protection of aggregation sites are in place. This project refined abundance and trend estimates for the eastern Australian grey nurse shark population by combining biopsy sampling, genetic analysis, stereo-video length measurement and statistical modelling. Tissue samples from more than 300 sharks were analysed using close-kin mark-recapture methods to identify family relationships and estimate adult population size. Stereo-video measurements supported improved age estimation using Australian-specific length-at-age models, reducing reliance on overseas growth data. Findings from the project provide a stronger evidence base for Australian and New South Wales government decision-making on grey nurse shark recovery and conservation. Refined estimates of adult abundance and population trend (described in the Final Project Report) enables reduced uncertainty in recovery assessments, and supports evaluation of current management arrangements, including spatial protections for aggregation sites. Outputs • Final project report [written]
-
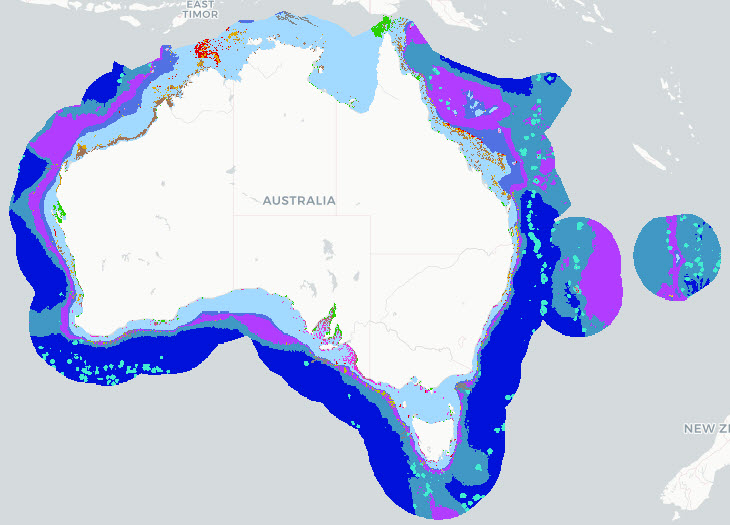
The Parks Australia Management Effectiveness (ME) system - previously MERI - is underpinned by a controlled, common language that provides a nationally consistent lexicon for a) Natural, cultural, and heritage values; (b) Social, cultural, and economic benefits; (c) Activities and anthropogenic pressures; and (d) Biophysical, and social and economic drivers. The Natural Values component of the common language is defined at three levels: 1) ecosystem complexes; 2) ecosystems; and 3) ecosystem components. This map shows the Ecosystems (tier 2) component of the Natural Values, and delineates features by habitat and depth for the Australian Exclusive Economic Zone (EEZ). This version (2022) of the National Values Ecosystems dataset uses Geoscience Australia's 250m resolution Australian Bathymetry and Topography Grid, 2009 (https://dx.doi.org/10.4225/25/53D99B6581B9A) as the basis for the map. See Hayes et al. 2021 and Dunstan et al. 2023 for a full definition of Natural Values Ecosystem terms, input datasets used, and processing steps involved with the creation of this map. Note that this dataset uses a combination of input data sources and interpolates where data gaps exist. The common language adopts a functional, largely geo-physical perspective to define surrogates for marine ecosystems. This dataset is not a substitute for a validated habitat map (see Seamap Australia National Benthic Habitat Layer: https://metadata.imas.utas.edu.au/geonetwork/srv/eng/catalog.search#/metadata/4739e4b0-4dba-4ec5-b658-02c09f27ab9a), but has a national coverage and provides valuable broad-scale categorisation of marine ecosystems in Australian waters. ***An updated version of this data is available, please see https://metadata.imas.utas.edu.au/geonetwork/srv/eng/catalog.search#/metadata/c6ed3079-f030-49e6-8316-a9595ed70f75 ***