geomorphology
Type of resources
Topics
Keywords
Contact for the resource
Provided by
Years
-

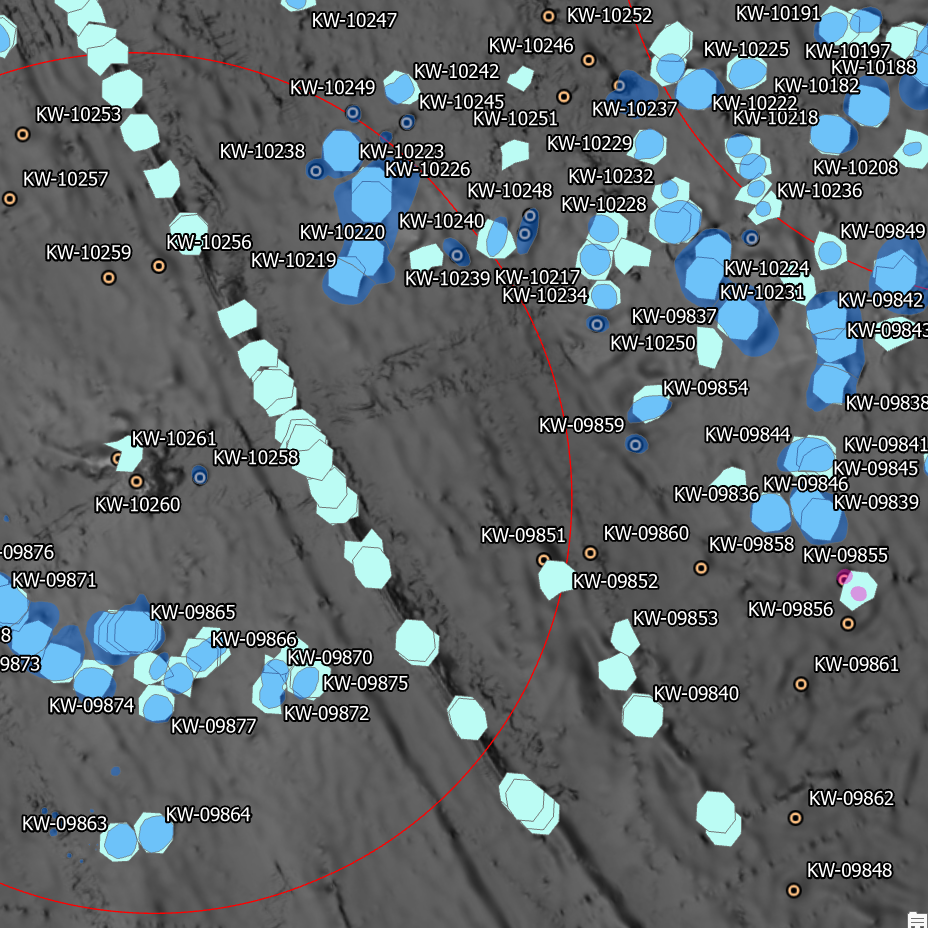
This dataset provides geomorphic features of the Australian Marine Parks (2022). The data was generated by Seamap Australia as part of an Our Marine Parks (Parks Australia) project with funding from the Australian Government to improve knowledge relating to classification of the Australian Marine Parks real estate. Bathymetry data was collated from existing AusSeabed data holdings and compiled into multi-resolution bathymetry mosaics for each Park (see https://metadata.imas.utas.edu.au/geonetwork/srv/eng/catalog.search#/metadata/fb451be4-9de1-4bc2-8fd6-0f285f90916f). All publicly available bathymetry data as at 30th June 2022 was included. Macquarie Island was updated on 25/08/2023 to reflect the new AMP boundaries. The Whitebox tools package in R was used to calculate geomorphometry using the geomorphron function. Processing for each Park was addressed manually, with search distances and slope thresholds adjusted between Parks depending on quality and resolution of bathymetry data, and characteristics of the seafloor. Geomorphons were classified into geomorphic features using the Dove et al (2020) Seabed Morphology Features Glossary. These geomorphic units provide a consistent way to classify the seabed and may be used in combination with visual validation methods to develop benthic habitat maps. Data is supplied as a Web Map Service of geomorphic features overlaid on hillshade for the mapped regions. Data is available for download as a zipped package of geotiffs with accompanying hillshade. ESRI .lyr file and QGIS .sld files are supplied for display in desktop GIS. All Parks with 25% or more bathymetry coverage were included in processing. The table below indicates the Parks included in this data package, and the percent coverage of geomorphic data for each, based on the bathymetry coverage available at the time of processing. Note that the current coverage of bathymetry may be greater than that expressed below and contained within this data package, for areas in which more recent surveys have been published. PARK % COVERAGE Abrolhos 36% Apollo 52% Beagle 35% Boags 31% Bremer 70% Carnarvon Canyon 72% Central Eastern* 47% (41%) Christmas Island* 31% (28%) Cod Grounds 97% Coral Sea* 100% (30%) East Gippsland 96% Eastern Recherche 29% Flinders 30% Franklin 51% Freycinet 40% Gascoyne 53% Geographe 25% Gifford 100% Great Australian Bight 36% Heard & McDonald Islands*† 100% (0%) Hunter 90% Huon 94% Jervis 99% Macquarie Island 40% Mermaid Reef 72% Murray 47% Nelson 58% Ningaloo 54% Norfolk 38% Perth Canyon 98% Solitary Islands 34% South Tasman Rise 59% South-west Corner 46% Tasman Fracture 99% Two Rocks 27% Western Eyre 25% Zeehan 74% * indicates Digital Elevation Model (DEM) data was included in analysis. Coverage of surveyed (non-modelled) bathymetry is shown in parentheses () † has been included in analysis but is not an Australian Marine Park For glossary of features, see: Dove et al. (2020) A two-part seabed geomorphology classification scheme (v.2); Part 1: morphology features glossary. http://dx.doi.org/10.5281/ZENODO.4075248
-

Seamounts, elevated seabed features, and bathymetric highs constitute ecologically significant habitats for various marine species, often associated with unique ecosystems and heightened biodiversity. In Australia, the absence of a comprehensive and spatially accurate inventory of these underwater structures has been a notable gap. Existing broad-scale modelling efforts, including the Parks Australia Natural Values Ecosystems (NVE) map (https://seamapaustralia.org/map/#af207808-481a-4648-93d3-4011f2689461), have predominantly relied on coarse, global datasets. These datasets, characterized by low resolution, often fail to incorporate recent bathymetric data, leading to the omission or incorrect identification of features. This work aimed to address these limitations by developing an improved dataset of raised seabed features, specifically designed to enhance broad-scale modelling efforts like those used in the NVE mapping, and in support of the objectives of NESP Marine and Coastal Hub Project 2.3 (https://www.nespmarinecoastal.edu.au/project/2-3/). Seamount features were extracted from a range of data sources (see 'lineage' section of this record) for the area surrounding the Australian continental margin. These were cross-referenced with GEBCO's 2023 global terrain model (15 arc-second interval grid) and any obviously erroneous features removed. This dataset includes all features located inside the Australian Exclusive Economic Zone (EEZ). Rather than cropping exclusively to this boundary, those features falling outside the Aus EEZ but in the approximate vicinity were also retained for context Existing feature boundaries were redigitised for areas in which more recent high-resolution bathymetry was available, utilising the 'Bathymetry of Australian Marine Parks (2024)' compilation dataset and individual survey datasets available through the AusSeabed data portal (https://portal.ga.gov.au/persona/marine). Where available, fine-scale geomorphic mapping in which seamounts and pinnacles had been classified were extracted and merged with the larger-scale features. If fine-scale mapping disagreed with features classified in the broader-scale datasets, the finer-scale data was prioritised. Where multiple features occurred immediately adjacent to each other, the digitised area represents the "footprint" of the features and as such, a single polygon may encompass multiple peaks. Where features could be uniquely identified (eg by a formal name/title), this attribute is included in the dataset.
-

This dataset is a compilation product of all publicly available surveyed bathymetry within the Australian Marine Parks (AMPs, 2025 boundaries), merged into a single multi-resolution composite per AMP. The data was compiled by Seamap Australia as part of an Our Marine Parks (Parks Australia) project with funding from the Australian Government to improve knowledge relating to classification of the Australian Marine Parks real estate. This compilation of bathymetry data was the first step in generating geomorphometry classifications (see https://metadata.imas.utas.edu.au/geonetwork/srv/eng/catalog.search#/metadata/40e9283b-d4ed-4176-8fe6-112b8697003f for derived geomorphometry maps). Bathymetry data was collated from AusSeabed data holdings (https://portal.ga.gov.au/persona/marine), the WA Bathymetry Portal (https://dot-wa.maps.arcgis.com/apps/webappviewer/index.html?id=d58dd77d85654783b5fc8c775953c69b), the Australian Ocean Data Network (https://portal.aodn.org.au/) and other existing public data repositories. A single multi-resolution bathymetry mosaic, and associated multi-resolution hillshade mosaic, was generated for each AMP. Data is supplied as a single Web Map Service of bathymetry on hillshade for the mapped regions. Data is available for download as (1) bathymetry, and (2) hillshade, Geotiff files for each AMP. The table below indicates the Parks included in this data package, and the percent coverage of bathymetric data for each. Parks not expressly listed below had no publicly accessible bathymetry data available from the sources listed in the 'lineage' section below. This dataset was last updated on 10/12/2025 and represents all public bathymetry data intersecting AMPs that could be located as of that date. PARK....................................................% COVERAGE Abrolhos...............................................56% Apollo*.................................................100% (63%) Arafura.................................................11% Argo-Rowley Terrace............................34% Arnhem.................................................<1% Ashmore Reef*.....................................100% (68%) Beagle*.................................................100% (56%) Boags*..................................................100% (31%) Bremer..................................................71% Carnarvon Canyon...............................82% Cartier Island*......................................100% (9%) Central Eastern*...................................48% (42%) Christmas Island*.................................44% (41%) Cocos (Keeling) Islands*......................23% (20%) Cod Grounds........................................98% Coral Sea*...........................................100% (30%) Dampier................................................61% East Gippsland.....................................100% Eastern Recherche...............................37% Eighty Mile Beach.................................69% Flinders*...............................................36% (32%) Franklin*...............................................100% (51%) Freycinet*.............................................60% (59%) Gascoyne.............................................67% Geographe...........................................25% Gifford*.................................................100% (70%) Great Australian Bight...........................40% Gulf of Carpentaria................................6% Heard & McDonald Islands*†...............100% (3%) Hunter...................................................90% Huon.....................................................95% Jervis...................................................100% Joseph Bonaparte Gulf*......................100% (0%) Jurien...................................................20% Kimberley*...........................................100% (14%) Lord Howe*..........................................16% (14%) Macquarie Island..................................100% (47%) Mermaid Reef.......................................83% Montebello............................................89% Murray..................................................50% Nelson..................................................62% Ningaloo...............................................55% Norfolk..................................................39% Oceanic Shoals*..................................100% (26%) Perth Canyon......................................100% Roebuck..............................................100% Shark Bay............................................16% Solitary Islands....................................100% South Tasman Rise..............................82% South-west Corner...............................53% Tasman Fracture..................................99% Twilight.................................................1% Two Rocks...........................................34% Wessel..................................................1% West Cape York*..................................100% (11%) Western Eyre........................................27% Western Kangaroo Island.....................6% Zeehan.................................................73% * indicates Digital Elevation Model (DEM) data was included in compilation. Coverage of surveyed (non-modelled) bathymetry is shown in parentheses () † has been included in analysis but is not an Australian Marine Park
-
The Oceanic Shoals survey (SOL5650, GA survey 339) was conducted on the R.V. Solander in collaboration with Geoscience Australia, the Australian Institute of Marine Science (AIMS), University of Western Australia and the Museum and Art Gallery of the Northern Territory between 12 September - 5 October, 2012. This dataset comprises an interpreted geomorphic map. Interpreted local-scale geomorphic maps were produced for each survey area in the Oceanic Shoals Commonwealth Marine Reserve (CMR) using multibeam bathymetry and backscatter grids at 2 m resolution and bathymetric derivatives (e.g. slope; 1-m contours). Six geomorphic units; bank, depression, mound, plain, scarp and terrace were identified and mapped using definitions suitable for interpretation at the local scale (nominally 1:10 000). Maps and polygons were manual digitised in ArcGIS using the spatial analyst and 3D analyst toolboxes. For further information on the geomorphic mapping methods please refer to Appendix N of the post-survey report, published as Geoscience Australia Record 2013/38: Nichol, S.L., Howard, F.J.F., Kool, J., Stowar, M., Bouchet, P., Radke, L., Siwabessy, J., Przeslawski, R., Picard, K., Alvarez de Glasby, B., Colquhoun, J., Letessier, T. & Heyward, A. 2013. Oceanic Shoals Commonwealth Marine Reserve (Timor Sea) Biodiversity Survey: GA0339/SOL5650 Post Survey Report. Record 2013/38. Geoscience Australia: Canberra. (GEOCAT #76658).
-
The data set provides outlines for the maximum extent of geomorphic units for Australia's Exclusive Economic Zone, including the offshore island territories, but not the Australian Antarctic Territory. These data were compiled as part of Geoscience Australia's integrated digital information system to provide improved accessibility and knowledge relating to the environmental management of Australia's oceans resources. The geomorphic units are to be used as surrogates for benthic habitats and can be best applied to the construction of bioregionalisations of the seabed. The data set also includes the name of units in the attribute table, where known, the source(s) of the names, feature codes and province codes as well as the area and perimeter of each unit. The data are accompanied by Geoscience Australia Record 2003/30. Updated October 2006.
-
The Petrel Sub-basin Marine Environmental Survey GA-0335, (SOL5463) was undertaken by the RV Solander during May 2012 as part of the Commonwealth Government's National Low Emission Coal Initiative (NLECI). The survey was undertaken as a collaboration between the Australian Institute of Marine Science (AIMS) and GA. The purpose was to acquire geophysical and biophysical data on shallow (less then 100m water depth) seabed environments within two targeted areas in the Petrel Sub-basin to support investigation for CO2 storage potential in these areas. This dataset comprises an interpreted geomorphic map. Interpreted local-scale geomorphic maps were produced for each survey area in the Petrel Sub-basin using multibeam bathymetry and backscatter grids at 2 m resolution and bathymetric derivatives (e.g. slope; 1-m contours). Five geomorphic units; bank, plain, ridge, terrace and valley, were identified and mapped using definitions suitable for interpretation at the local scale (nominally 1:10 000). Maps and polygons were manual digitised in ArcGIS using the spatial analyst and 3D analyst toolboxes.
-
Providing accurate maps of coral reefs where the spatial scale and labels of the mapped features correspond to map units appropriate for examining biological and geomorphic structures and processes is a major challenge for remote sensing. The objective of this work is to assess the accuracy and relevance of the process used to derive geomorphic zone and benthic community zone maps for three western Pacific coral reefs produced from multi-scale, object-based image analysis (OBIA) of high-spatial-resolution multi-spectral images, guided by field survey data. Three Quickbird-2 multi-spectral data sets from reefs in Australia, Palau and Fiji and georeferenced field photographs were used in a multi-scale segmentation and object-based image classification to map geomorphic zones and benthic community zones. A per-pixel approach was also tested for mapping benthic community zones. Validation of the maps and comparison to past approaches indicated the multi-scale OBIA process enabled field data, operator field experience and a conceptual hierarchical model of the coral reef environment to be linked to provide output maps at geomorphic zone and benthic community scales on coral reefs. The OBIA mapping accuracies were comparable with previously published work using other methods; however, the classes mapped were matched to a predetermined set of features on the reef.
-
Geoscience Australia has completed the first phase of an areal map of Australia's coastal geomorphological units. Utilising pre-existing GIS datasets procured from local, state and federal government agencies, this national scale map conforms to a coastal geomorphology classification scheme developed at Geoscience Australia. Phase one consists of a geodatabase containing a series of state wide feature datasets that have been reclassified into the national coastal geomorphology classification scheme.
 IMAS Metadata Catalogue