 IMAS Metadata Catalogue

Type of resources
Topics
Keywords
Contact for the resource
Provided by
Years
-
Water samples for the analysis of pigments using High Performance Liquid Chromatography (HPLC) were collected only in the first 12 months of the sampling program. Pigment analysis is used to estimate algal community composition and concentration. Pigments which relate specifically to an algal class are termed marker or diagnostic pigments. Some of these diagnostic pigments are found exclusively in one algal class (e.g. prasinoxanthin in prasinophytes), while others are the principal pigments of one class, but are also found in other classes (e.g. fucoxanthin in diatoms and some haptophytes; 19′-butanoyloxyfucoxanthin in chrysophytes and some haptophytes). The presence or absence of these diagnostic pigments can provide a simple guide to the composition of a phytoplankton community, including identifying classes of small flagellates that cannot be determined by light microscopy techniques. There was general similarity in pigment composition between all sites, with a presence of diatoms (as indicated by fucoxanthin), haptophytes (hex-fucoxanthin), prasinophytes (prasinoxanthan), cryptophytes (alloxanthan), cyanophytes (zeaxanthan) and green algae (chl-b) in nearly all monthly samples at all sites. The green algae could be in the form of euglenophytes or prasinophytes; the absence of the pigment lutein in all samples indicates that chlorophytes are not present in Storm Bay, at least at the sites sampled.
-
Voyage IN2019_V04 contributed an additional 29,000 kms2 of seafloor survey data to the Coral Sea knowledge base. From this new bathymetric data individual seamounts have been extracted and have been classified to the Geoscience Australia Geomorphology Classification Scheme. This dataset contains two layers representing the classification layers- 1) Surface (Plain, Slope, Escarpment) and 2) fine scale Geomorphology of the seamount for the Mellish Seamount. Ongoing research with this survey data will provide new insights into the detailed geomorphic shape and spatial relationships between adjacent seabed features. This information will be released in future publications to show the potential of how the scale of such seafloor data can be used for predictive habitat modelling when analysed with the biological data overlays.
-
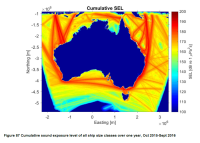
***NOTE THIS RECORD HAS BEEN SUPERSEDED BY NESP PROJECT E2 (details below)*** Cumulative Sound Exposure Levels of shipping traffic in Australian waters was undertaken over a one year period (Sept. 2015 to Oct 2016) within the Australian Exclusive Economic Zone. A proof of concept cumulative ship noise map was developed around Australia using the Perth Canyon source spectra as the source level for different vessel type categories. Sound propagation models were then run cumulatively, integrating the time spent by ships within a grid cell over the one-year period. This record describes the proof of concept map of commercial shipping noise in Australian waters developed under NESP Project C5. Refer to final report (https://www.nespmarine.edu.au/document/quantification-risk-shipping-large-marine-fauna-across-australia-final-report) for full methodology and PDF map. The ship noise modelling demonstrated the potential for using simple and readily accessible transmission models to provide an accurate representation of shipping noise within the marine soundscape. A subsequent high resolution sound exposure map was generated under NESP Project E2. See https://catalogue.aodn.org.au/geonetwork/srv/en/metadata.show?uuid=480847b4-b692-4112-89ff-0dcef75e3b84
-
Compete © is a spatial individual-based modelling package facilitating study of population and community dynamics and evolution in assemblages of sessile modular organisms competing for space. The kernel of its operation is a probabilistic cellular automaton, but with additional functions for recruitment, mortality, dispersal and disturbance. The model uses synchronous updating of the landscape.
-
A project investigating the restoration of string kelp (Macrocystis pyrifera) habitat on Tasmania's east and south coasts. Macroalgae, fish and invertebrate counts were collected as part of the project using the Edgar Barrett transect technique in the Derwent Estuary and in the Mercury Passage on the South East Tasmania. Other fish, invertebrate and macroalgal data was also collected.
-
The spatial extent of C. rodgersii "barrens" was estimated by surveying rocky reef habitat with a towed underwater video system. Sampling took place at 13 regions along the east coast of Tasmania, each comprising 3 subsites, this dataset refers to the St Helens region, and its 3 subsites: Binalong Bay, St Helens Island and St Helens Point
-

This record provides an overview of the NESP Marine and Coastal Hub Research Plan 2023 project "Assessing changes in black rockcod abundance and size". For specific data outputs from this project, please see child records associated with this metadata. -------------------- This project will assess the relative abundance and size of the threatened black rockcod (Epinephelus daemelii) to inform how the species is responding to conservation and management actions. In 2010, a broadscale survey (81 sites) was undertaken in northern NSW and Lord Howe Island, followed by subsequent surveys of a subset of these sites approximately every 4-5 years. This project proposes to repeat the surveys of the initial 81 baseline sites to assess if protection measures, such as marine protected area sanctuary zones, are assisting in recovery of black rockcod. Overall, this will provide a 13-year time series (2010 – 2023) that will be used to indicate if black rockcod are increasing in abundance, getting larger, and/or becoming more widespread, all indicators that can be used to assess if recovery actions being implemented are effective. Outputs • underwater visual census (UVC) data for black rock cod [dataset] • Final project report [written]
-
This study considered a range of water-column and sediment (benthos) based variables commonly used to monitor estuaries,utilising estuaries on the North-West Coast of Tasmania (Duck, Montagu, Detention, and Black River). These included: salinity, dissolved oxygen, turbidity, nutrient and chlorophyll a levels for the water-column; and sediment redox, organic carbon content, chlorophyll a and macroinvertebrate community structure amongst the benthos. In addition to comparing reference with impacted estuaries, comparisons were also made across seasons, commensurate with seasonal changes in freshwater river input, and between regions within estuaries (upper and lower reaches) - previously identified in Hirst et al. (2005). This design enabled us to examine whether the detection of impacts (i.e. differences between reference and impacted systems) was contingent on the time and location of sampling or independent of these factors. The data represented by this record was collected in the Black River.
-
Redmap is a primarily a website that invites the community to spot, log and map marine species that are uncommon in their region, or along particular parts of their coast. The information collected is mapped and displayed on the site, demonstrating, in time, how species distributions may be changing. Sightings are divided into two categories – those with a photo that can be ‘verified’ by a marine biologist, and sightings without photos that we call community sightings (anecdotal). All the information collected, with and without photos, is mapped and will be used in the following years to map out a ‘story’ of changes occurring in our marine environment. The main data collected includes the species sighted (normally selected from a list comprising preselected species of interest), the location, date/time and activity being undertaken. Other optional information gathered include biological data such as sex, size and weight and environmental data such as water depth and temperature and habitat. This record is associated with live data (and will subsequently change over time) and spatial elements have reduced accuracy. It is also subject to a three year embargo (ie. does not contain data less than three years old). If you wish to discuss obtaining a citable, static dataset, that is current and/or contains accurate spatial elements, please see Point of Contact.
-
Inter-moult duration in giant crabs (Pseudocarcinus gigas) was estimated by an alternative method to utilising tag-recovery data. Reproduction in female giant crabs occurs in annual cycles, although females occasionally “skip” a reproductive season and do not become ovigerous; it has been noted previously that this appears to be associated with molting. Thus the proportion of females that do not participate in reproduction may indicate the proportion molting. This approach was tried with a sample of 342 females and the number that were “skipping” a reproductive season was measured by computerized tomography scanning (CT-scanning) of their ovaries prior to the extrusion of eggs. Radiometric aging (228Th/ 228Ra) of carapaces was also undertaken with the focus of this work on testing an assumption of the method, rather than describing the intermolt duration of a population.