 IMAS Metadata Catalogue
2018
Type of resources
Topics
Keywords
Contact for the resource
Provided by
Years
-
Observational data for the Kelp Ecosystem Ecology Network. These data come from transects of rocky reefs taken around the world using the KEEN observational data protocol (see http://kelpecosystems.org for full description of methods and handbook). See “How” for methods. Briefly, the observational data consists of the following components, all included here: site information, fish observations, quadrat sampling, band transect sampling, percent cover from uniform point counts, and kelp morphometrics. Data Files Data files included and what they contain are as follows: keen_sites.csv - Physical and locational data for all KEEN sites and transect. keen_cover.csv - Percent cover of sessile algae and invertebrates. keen_fish.csv - Counts of fish by size class along a transect. keen_quads.csv - Counts of common algae, sessile invertebrates, and demersal fish that can be individuated. keen_swath.csv - Counts of rarer algae, sessile invertebrates, and demersal fish that can be individuated. Data Use To use the observational data here for published work we ask that 1) You contact the network coordinator, jarrett.byrnes@umb.edu, and notify them of your intention so that we can coordinate among any ongoing projects using the same data, 2) if the data has not been used in a publication in the literature before, we request that you reach out to the PIs responsible for the data you will be using and engage in a conversation about co-authorship, 3) if it has been used previously, merely cite the datasets associated with each PI that you use. The references are listed below. For access to the entire data cleaning and processing pipeline, see https://github.com/kelpecosystems/observational_data. For access to scans of the original data sheets, contact jarrett.byrnes@umb.edu. ------------------------------------------------------ For general methods: Byrnes, Jarrett E.K., Haupt, Alison J., Reed, Daniel C., Wernberg, Thomas., Pérez-Matus, Alejandro., Shears, Nick T., Konar, Brenda, Gagnon, Pat, and Vergés, Adriana. 2014. Kelp Ecosystem Ecology Network Monitoring Handbook. Kelp Ecosystem Ecology Network. For specific data sets, use the following, but also include date the data is accessed from this record in order to track the data version used. Byrnes, Jarrett E.K., Haupt, Alison J., Lyman, Ted. 2014. Kelp forest communities at Appledore Island, the Boston Harbor Islands, and Salem Sound. Kelp Ecosystem Ecology Network. Dijkstra, Jennifer A., Mello, Kristen. 2015. Kelp forest communities at York, Maine. Kelp Ecosystem Ecology Network. Grabwoski, Jonathan and MacMahan, Marissa. 2015. Kelp forest communities in Nahant, Massachusetts, and Pemaquid, Maine. Kelp Ecosystem Ecology Network. Humphries Austin T., Paight C, Ben-Horin Tal, Green Lindsay, Thornber, Carol. 2016. Kelp forest communities in Narragansett Bay, Rhode Island. Kelp Ecosystem Ecology Network. Rasher, Douglass and Price, Nicole. 2017. Kelp forest communities of central and downeast Maine. Kelp Ecosystem Ecology Network. Peréz-Matus, Alejandro and Shaughnessy, Brianna. 2017. Kelp forest communities of central and northern Chile. Kelp Ecosystem Ecology Network.
-
This dataset comes from the Floating Forests project (https://floatingforests.org). Floating Forests is an online citizen science project attempting to map the cover of surface-canopy forming kelps, primarily the giant kelp Macrocystis pyrifera, using Landsat data. To acquire the data, citizen scientists were given tiles of images taken from the Landsat series of satellites (https://landsat.usgs.gov/) scenes that had been manipulated to make kelp more visible. Landsat has a roughly two week repeat time for the entire globe and a 30m resolution, although given variability in weather quarterly aggregation is recommended. Each image was scene at minimum four times. If no kelp was noted, then it was retired and scored as a zero. If kelp was noted in the first four classifications, then an individual image was shown to fifteen people total. The polygons of kelp beds presented here represent consensus classifications from the platform and are tagged with minimum number of users who classified pixels in the polygons as kelp. For example, at the five user threshold, each area represents pixels where at least five users - not necessarily the same five users - said there was kelp present. This consensus classification has been shown to match very closely to expert classifications. For more information and links to outputs, see https://blog.floatingforests.org in addition to the main project site. Or go to the main project site, and start a conversation in the "talk" section of the site.
-
This record provides an overview of the scope and research output of the NESP Marine Biodiversity Hub project "Guidelines for analysis of cumulative impacts and risks to the Great Barrier Reef". No data outputs were generated by this project. -------------------- The project will develop guidance for the analysis of cumulative impacts and risks to the environmental, social and economic values of the GBR. The project will use existing information to develop guidance for use by GBRMPA, DoEE, the Queensland Government and proponents of future development proposals. The project will build on the work undertaken in the GBR Strategic Assessment and support works undertaken under the Reef 2050 plan. The guidance will provide a practical science-based approach to assessment of cumulative risks to the Reef. Research will focus on providing a general and repeatable approach to be applied at the whole-of-reef scale (to meet planning, assessment and reporting requirements of the GBRMPA) and also at the development-site-scale (to meet the environmental assessment requirements of the GBRMPA and future proponents). The guidance will be developed in close collaboration with the GBRMPA and DoEE to ensure it is practical and compatible with relevant legislation and policy applicable to proposed actions within the GBR. The project will include a case study focused on attributing impacts of pressures and their cumulative impacts on shallow-water coral reefs of eastern Australia (including cumulative impacts for the whole-of-GBR). It will also examine how this could be applied to shallow temperate reefs follow recent risk assessments conducted in NSW. Research is primarily designed to meet the specific needs of GBRMPA and future proponents. NSW DPI, QLD Government and Parks Australia, may also benefit from the case study and insights to assessment of cumulative impacts. Planned Outputs • Case Study Report on GBR & Coral Sea reefs pressure analysis. • Final report - guidance for analysis of cumulative impacts and risk
-
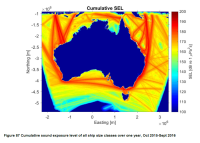
***NOTE THIS RECORD HAS BEEN SUPERSEDED BY NESP PROJECT E2 (details below)*** Cumulative Sound Exposure Levels of shipping traffic in Australian waters was undertaken over a one year period (Sept. 2015 to Oct 2016) within the Australian Exclusive Economic Zone. A proof of concept cumulative ship noise map was developed around Australia using the Perth Canyon source spectra as the source level for different vessel type categories. Sound propagation models were then run cumulatively, integrating the time spent by ships within a grid cell over the one-year period. This record describes the proof of concept map of commercial shipping noise in Australian waters developed under NESP Project C5. Refer to final report (https://www.nespmarine.edu.au/document/quantification-risk-shipping-large-marine-fauna-across-australia-final-report) for full methodology and PDF map. The ship noise modelling demonstrated the potential for using simple and readily accessible transmission models to provide an accurate representation of shipping noise within the marine soundscape. A subsequent high resolution sound exposure map was generated under NESP Project E2. See https://catalogue.aodn.org.au/geonetwork/srv/en/metadata.show?uuid=480847b4-b692-4112-89ff-0dcef75e3b84
-
Meta data of all tagged hammerhead sharks detailing tag dates, locations, and shark biological details.
-
Relevant spatial datasets for mapping pressures were identified and collated. Pressures were categorised as resource extraction and use, pollution, habitat modification, climate, and ‘other’. Pressures included Commonwealth trawl fisheries effort, aquaculture infrastructure, location of oil and gas infrastructure, historical shipping and pollution data, location of historical seismic operations, cyclone intensity, spoil dumping, sewage outfalls, location of ports, and tourism operations. Two main pressure maps were derived i) an additive pressure hotspots map, which gives higher weight to areas with multiple pressures of high risk; and, ii) a multiplicative hotspot pressure map, which gives lower weighting to areas with multiple low risk pressures. Areas of high risk were identified, and thus possibly high benefit for management versus low risk or low associated benefit for mitigation. The information generated needs to be considered alongside robust species distribution data and interaction matrices for effective decision-making.
-
Biologically relevant macronutrients, nitrate + nitrite, silicate, phosphate and ammonia, were measured at all sites throughout the study. Nitrate + nitrite values (NOx) at the surface showed clear seasonal trends, peaking over winter and drawing down to near zero in summer and autumn. Phosphate concentrations also reached a peak in winter, which was associated with Southern Ocean influence. Median ammonium concentrations at all sites were generally <0.5 μM, with no clear peaks in any season or month. Overall, the lowest values were measured in August and other months showed reasonable spread around the median. Median silicate concentrations were consistently highest at sites 1 and 9, followed by site 5. Water from the River Derwent flows through site 1, then tracks east towards site 9 then site 5. Seasonally, silicate was generally highest in winter when the River Derwent outflow is also greatest.
-
Chlorophyll a concentration is widely used as a proxy to describe trends in phytoplankton biomass over spatial and temporal scales. The concentration of chlorophyll a in Storm Bay showed surprisingly little variation across the seasons. There was a gradient in concentration from site 1 to site 3, where chlorophyll a decreased slightly. It was highest and most variable at the inshore sites 1 and 9, and lowest at site 3, furthest out in the bay. There was no clear annually recurrent seasonal bloom, although data suggests higher values in spring and autumn (see later time series).
-
White sharks are listed as vulnerable under the Commonwealth Environment Protection and Biodiversity Conservation Act 1999 and actions to assist their recovery and long-term viability are prescribed in a national recovery plan for the species. A priority action is to develop an effective means of estimating the size of white shark populations and monitor their status (population trend). This would provide a scientific basis for assessing recovery actions, and for local policies governing human-shark interactions: an issue of significant public concern. NESP Project A3 provides a national assessment of the southern-western adult white shark population abundance and an update of the total eastern Australasian white shark population abundance and status in order to establish the efficacy of existing recovery actions and provide a scientifically sound and rational basis from which to inform policies that aim to balance conservation objectives and public safety. This record describes the individual DNA sequencing of over 500 animals for CK-MR analyses of SA/WA population tissue samples.
-
The CSIRO’s Oceans & Atmosphere Shallow Survey Internal Facility (SSIF) was contracted by the Institute for Marine and Antarctic Studies (IMAS) of the University of Tasmania (UTAS) in collaboration with Parks Australia, to undertake a hydrographic survey of the Boags Commonwealth Marine Reserve in the southwestern Bass Strait. This site was surveyed in conjunction with other smaller sites for Petuna Aquaculture, as part of a broader survey campaign. All of the sites covered in this campaign are located in the vicinity of the Hunter Group of Islands, off the north-western coast of Tasmania.