 IMAS Metadata Catalogue
climatologyMeteorologyAtmosphere
Type of resources
Topics
Keywords
Contact for the resource
Provided by
Years
-
Data pertain to the analysis of Antarctic Ice Sheet (AIS) mass variability during different ENSO phases, using GRACE‑observed mass changes and modelled surface mass balance from RACMO2.4p1 over the period 2002–2022, together with associated atmospheric circulation patterns. The gridded datasets include derived quantities from the regression analyses for the defined ENSO periods and AIS mass‑change trends, provided in NetCDF format, along with the accompanying MATLAB code.
-
Cyclone data was used to develop a spatial model using the intensity and to determine whether Sea Surface Temperature or Tropical Cyclone Heat Potential contributes to the North Indian Ocean cyclone intensity and, if so, how?
-
This resource contains access links to all data collected and and created under the ACE-CRC program. See 'online resources' section of this record for index of all online ACE-CRC data.
-
Ice cores from Mount Brown South (MBS), East Antarctica, were drilled to help understand the past atmospheric circulation variability in the southern Indian Ocean and southwest Pacific Ocean. There are visible bubble-free layers occurring frequently multiple times a year, and the origin of these features is still unknown. This project aims to determine whether the bubble-free layers in the MBS ice core can be related to atmospheric processes. ERA-5 data, including surface (skin) temperature, 2 metre air temperature, wind at 10 metre height, the mean surface downward short-wave radiation flux and snowfall, is used to assess the target climate variables from 1979 to 2017 at the ice core sites.
-
The data result from an analysis of gridded satellite altimetry time series of ice surface elevation for the Antarctic Ice Sheet. Multiple linear regression is performed, including parameters associated with the cumulative sum of each of the Southern Annular Mode (SAM) and El Nino/Southern Oscillation (ENSO). The gridded data include the original data and the derived parameters and statistical values. Four grids are provided. Two grids are from separate regressions performed on data after applying one of two different spatial smoothing filters (10 km and 200 km Gaussian functions). Two further grids are from regressions after subtracting one of two firn densification models from the 10 km-smoothed altimetry data.
-
The prolonged rainfall reduction in South West Western Australia (SWWA) in recent decades has previously been reported to be unprecedented in the past 750 years. This rainfall reduction has reduced the water supply for both residents and agriculture in SWWA. However, the cause of this rainfall reduction is unclear. The relatively short length of the SWWA instrumental rainfall record limits long term studies of SWWA rainfall. In this study, SWWA rainfall is reconstructed based on a statistically significant negative correlation between SWWA rainfall and snowfall at Dome Summit South (DSS), East Antarctica. The 2000-year DSS snow accumulation record is used to reconstruct SWWA rainfall from 22 BCE to 2015 CE. With Cumulative Summation (CUSUM) analysis applied to the rainfall reconstruction, it is found that SWWA rainfall started to reduce around 1971 CE. This prolonged rainfall reduction is unprecedented during the past 750 years, but there have been two prior droughts of similar duration and intensity during the past 2000 years. Applying statistical techniques to compare the rainfall reconstruction with climate model simulations, it is found that greenhouse gases are likely to be the dominant driver of the SWWA rainfall drying trend after 1971 CE. This record describes the Honours Thesis [available for download in 'Online Resources' section of thsi record]. For the data generated by this project, see https://metadata.imas.utas.edu.au/geonetwork/srv/eng/catalog.search#/metadata/d7d5ea56-f972-435d-b44b-44fea598150c
-
'Weather@home ANZ' is a global citizen science distributed computing project being run as part of the Oxford-based 'weather@home' project, which is part of 'climateprediction.net'. In this experiment, a detailed limited area (regional) climate model is embedded within the less detailed 'driving' global model. This higher-resolution regional model is able to tell us in unprecedented detail about potential changes to patterns of weather as climate changes. In the initial 'weather@home' experiment launched in 2010, the project team released this regional modelling capability for three regions: Europe, Southern Africa and the Western USA. This capability has been extended to other regions around the world and the first such new region to be developed was the Australasian region encompassing Australia, New Zealand and surrounding areas, which was launched to the public in 2014. This particular part of the project - 'weatherathome ANZ' - has received support from the University of Oxford (U.K.), the U.K. Met. Office, the Universities of Melbourne and Tasmania (Australia), the Tasmanian Partnership for Advanced Computing and the New Zealand National Institute for Water and Atmospheric Research (NIWA). 'weather@home' has also been supported by Microsoft Research.
-
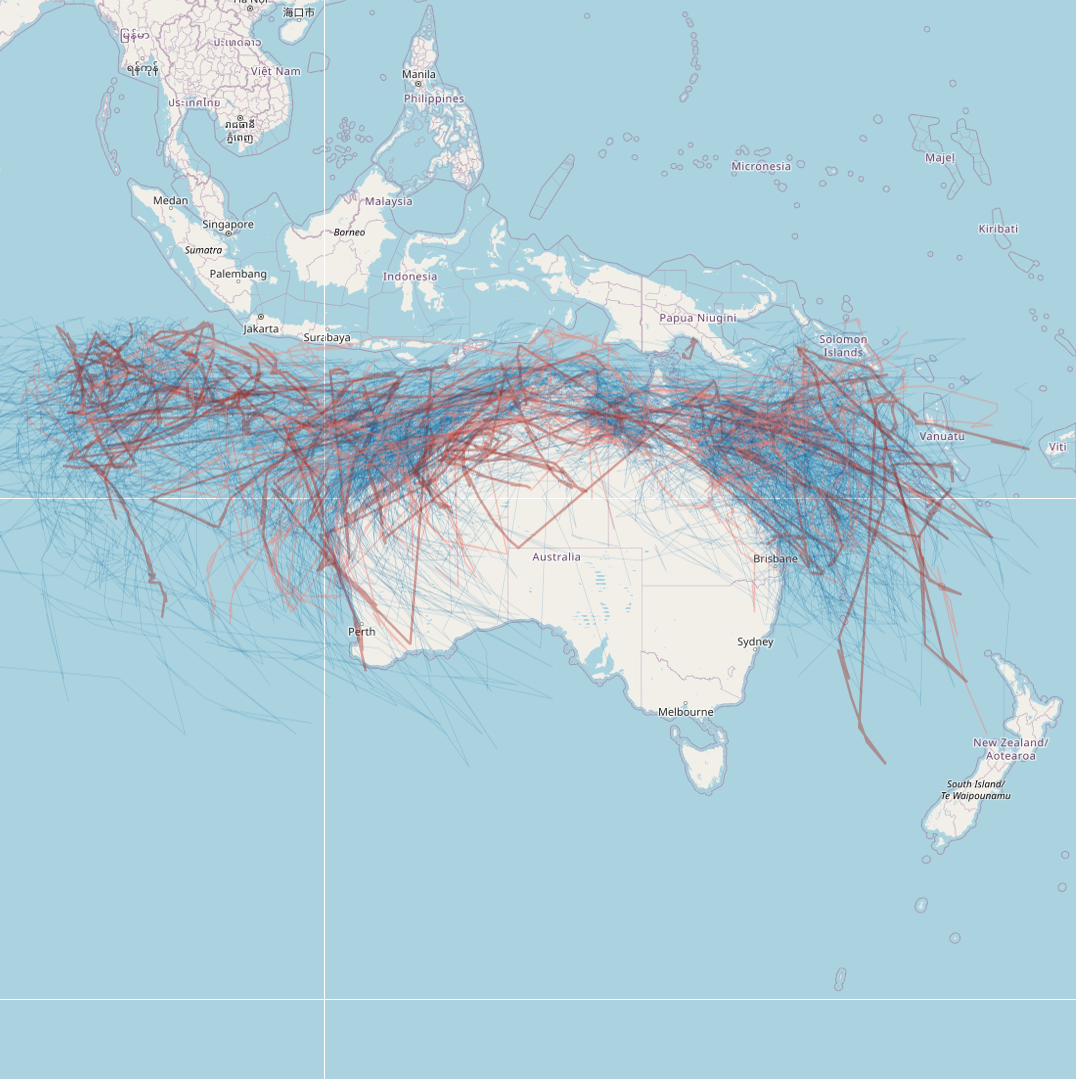
This dataset details all tropical cyclones that are known to have occurred in the region south of the equator between 90E and 160E. The data has been sourced from the Tropical Cyclone Database, maintained by the Bureau of Meteorology (BOM). This record represents a snapshot of the data taken on 23/03/2023 for the purposes of generating a mapping visualisation of recent cyclone activity. The most current database can be downloaded from the BOM website: http://www.bom.gov.au/cyclone/tropical-cyclone-knowledge-centre/databases/ Point data from the BOM has been converted into cyclone tracks for visualisation. The data and mapping layer will be refreshed annually following cyclone season (May-June each year). Last updated 21st November 2023.
-
A 2038-year South West Western Australia rainfall reconstruction. The prolonged rainfall reduction in South West Western Australia (SWWA) in recent decades has previously been reported to be unprecedented in the past 750 years. This rainfall reduction has reduced the water supply for both residents and agriculture in SWWA. However, the cause of this rainfall reduction is unclear. The relatively short length of the SWWA instrumental rainfall record limits longterm studies of SWWA rainfall. In this study, SWWA rainfall is reconstructed based on a statistically significant negative correlation between SWWA rainfall and snowfall at Dome Summit South (DSS), East Antarctica. The 2000-year DSS snow accumulation record is used to reconstruct SWWA rainfall from 22 BCE to 2015 CE. With Cumulative Summation (CUSUM) analysis applied to the rainfall reconstruction, it is found that SWWA rainfall started to reduce around 1971 CE. This prolonged rainfall reduction is unprecedented during the past 750 years, but there have been two prior droughts of similar duration and intensity during the past 2000 years. Applying statistical techniques to compare the rainfall reconstruction with climate model simulations, it is found that greenhouse gases are likely to be the dominant driver of the SWWA rainfall drying trend after 1971 CE.
-
Data pertain to analysis of GRACE time series of mass change in both gridded and basin format. The GRACE data are based on the COST-G solution obtained from http://gravis.gfz-potsdam.de/home. Both 50km regular gridded data and basin-level time series are included, as well as the SAM and ENSO climate indices on which the regressions were based. The gridded datasets provided here include derived quantities from the regressions such as trends, uncertainties, and regression coefficients in NetCDF format.