 IMAS Metadata Catalogue
Biotic taxonomic identification
Type of resources
Topics
Keywords
Contact for the resource
Provided by
Years
-
This spatial polygon dataset is derived from the 2001 mapping of mud crab (Scylla serrata) habitats along the NT and Queensland coastal wetlands. The polygons were derived from Landsat imagery and verified with field work and is suitable for use at scale 1:100,000. The information can be used in many ways to assist the management of these habitats. It provides a suitable baseline dataset for monitoring broad scale changes in area and composition of coastal wetland communities. Additionally, it provides information required by managers for choosing representative habitats for protection.
-
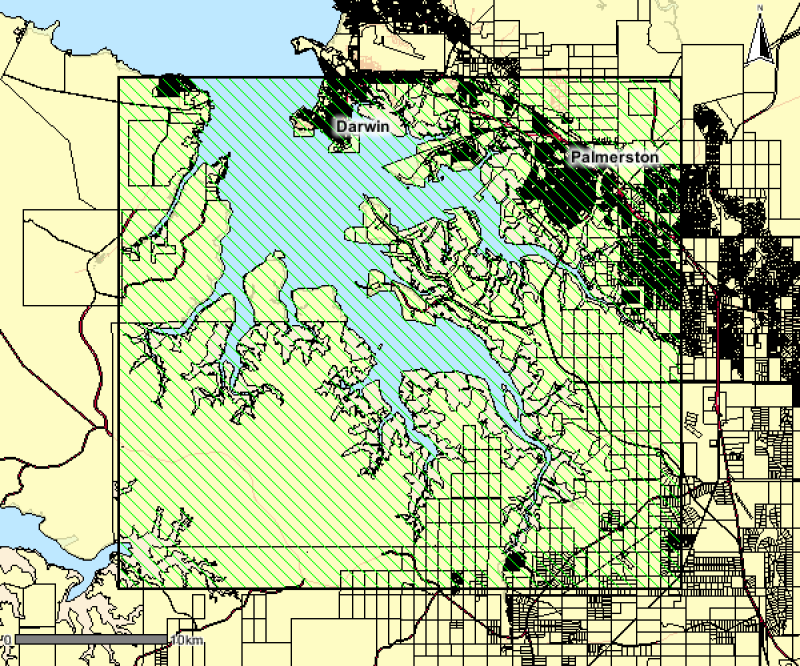
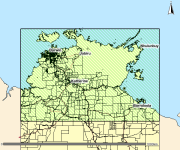
This polygon spatial dataset describes the mangrove communities for Darwin Harbour and its environs and was surveyed at a mapping scale of 1:25 000. The associated report notes an area of approximately 20,400 hectares of mangroves in Darwin Harbour and describes ten main mangrove associations or communities. The data provides a basis for identifying the extent and distribution of mangrove communities for Darwin Harbour and its environs.
-
This is a collection of polygons outlining signficant seagrass meadows around Arnhem Land, Kakadu and Gulf of Carpentaria coastal waters for the Northern Australia Marine Biodiversity Survey (NAMBS) project between 2003 and 2005. Data was collected from imagery and ground truthed by observers from helicopter and insitu sample grabs.
-
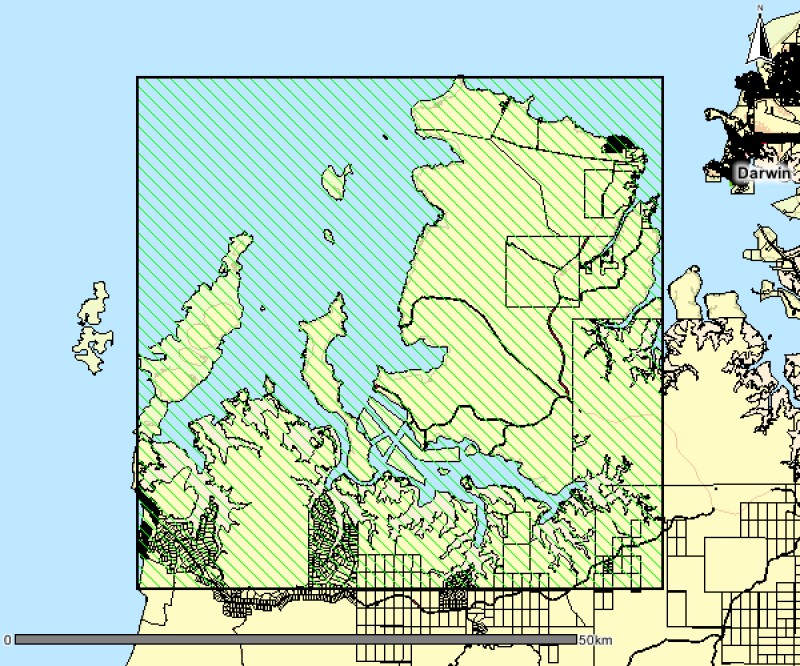
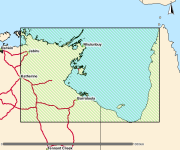
This polygon spatial dataset describes the mangrove communities for Bynoe Harbour and its environs. The original field survey was undertaken in 1998 at a mapping scale of 1:25,000. The associated report notes an area of approximately 24,000 hectares of mangroves in Bynoe Harbour and describes ten main mangrove associations or communities. The data provides a basis for identifying the extent and distribution of mangrove communities for Bynoe Harbour and its environs. Mangrove mapping was updated over this area in a 2016 survey. See metadata record for Mangrove Community Mapping - Charles Point to Gunn Point. www.ntlis.nt.gov.au/metadata/export_data?type=html&metadata_id=87F656131848A609E050CD9B214417E1
-

This polygon spatial dataset describes the benthic habitats likely to occur in marine environments around Gunn Point Peninsula and informs the desktop assessment of the marine biodiversity values for the region. The benthic habitats are inferred from existing information but in most cases require further data collection to validate and refine. Habitat modelling forms the basis of benthic community value assessment for Shoal Bay (Galaiduk et al. 2019). The accompanying report Marine and Coastal Biodiversity Assessment of the Gunn Point Area (2020) forms part of the Mapping the Future Project - Gunn Point. This project has identified land capability, water availability and biodiversity values to support land planning and inform development potential over the Gunn Point area. Reports and maps can be viewed from the webpage: denr.nt.gov.au/land-resource-management/development-opportunities - Development Potential of the Gunn Point Area (2020) - Biodiversity Assessment of the Gunn Point Area (2020) - Groundwater Resources of the Gunn Point Area (2020) - Marine and Coastal Biodiversity Assessment of the Gunn Point Area (2020) - Soil and Land Resources of the Gunn Point Area (2020) - Soil and Land Suitability Assessment for Irrigated Agriculture in the Gunn Point Area (2017) - Vegetation Communities of the Gunn Point Area (2020)
-
This is a high resolution survey (1:5,000 scale dataset) describing mapped vegetation communities for the Ludmilla Creek catchment area (within the City of Darwin, Northern Territory). (Vegetation Unit - A reasonably homogeneous part of the land surface, distinct from surrounding terrain with constant properties in landform and vegetation) This vegetation survey was undertaken in 1996. This dataset represents the vegetation on the ground at the time of the survey and reflects the data and methods used to create the mapped polygons. The dataset has been revised in 2015 to include community descriptions but has not been updated to reflect the vegetation on the ground. The Darwin Remnant Vegetation Survey is considered a more up-to-date representation of vegetation for this area.
-
This dataset comes from the Floating Forests project (https://floatingforests.org). Floating Forests is an online citizen science project attempting to map the cover of surface-canopy forming kelps, primarily the giant kelp Macrocystis pyrifera, using Landsat data. To acquire the data, citizen scientists were given tiles of images taken from the Landsat series of satellites (https://landsat.usgs.gov/) scenes that had been manipulated to make kelp more visible. Landsat has a roughly two week repeat time for the entire globe and a 30m resolution, although given variability in weather quarterly aggregation is recommended. Each image was scene at minimum four times. If no kelp was noted, then it was retired and scored as a zero. If kelp was noted in the first four classifications, then an individual image was shown to fifteen people total. The polygons of kelp beds presented here represent consensus classifications from the platform and are tagged with minimum number of users who classified pixels in the polygons as kelp. For example, at the five user threshold, each area represents pixels where at least five users - not necessarily the same five users - said there was kelp present. This consensus classification has been shown to match very closely to expert classifications. For more information and links to outputs, see https://blog.floatingforests.org in addition to the main project site. Or go to the main project site, and start a conversation in the "talk" section of the site.
-

This global meta-analysis documents data from underwater visual surveys used to determine the effect of kelp bed disturbance and canopy density on the abundance and structure of fish communities. Spatial, temporal and ontogenetic variability of many key fish species was examined at various levels of kelp disturbance at sites spanning a global temperate distribution. Rocky reef habitats and fisheries management regimes of sites were also examined as covariates.
-
Observational data for the Kelp Ecosystem Ecology Network. These data come from transects of rocky reefs taken around the world using the KEEN observational data protocol (see http://kelpecosystems.org for full description of methods and handbook). See “How” for methods. Briefly, the observational data consists of the following components, all included here: site information, fish observations, quadrat sampling, band transect sampling, percent cover from uniform point counts, and kelp morphometrics. Data Files Data files included and what they contain are as follows: keen_sites.csv - Physical and locational data for all KEEN sites and transect. keen_cover.csv - Percent cover of sessile algae and invertebrates. keen_fish.csv - Counts of fish by size class along a transect. keen_quads.csv - Counts of common algae, sessile invertebrates, and demersal fish that can be individuated. keen_swath.csv - Counts of rarer algae, sessile invertebrates, and demersal fish that can be individuated. Data Use To use the observational data here for published work we ask that 1) You contact the network coordinator, jarrett.byrnes@umb.edu, and notify them of your intention so that we can coordinate among any ongoing projects using the same data, 2) if the data has not been used in a publication in the literature before, we request that you reach out to the PIs responsible for the data you will be using and engage in a conversation about co-authorship, 3) if it has been used previously, merely cite the datasets associated with each PI that you use. The references are listed below. For access to the entire data cleaning and processing pipeline, see https://github.com/kelpecosystems/observational_data. For access to scans of the original data sheets, contact jarrett.byrnes@umb.edu. ------------------------------------------------------ For general methods: Byrnes, Jarrett E.K., Haupt, Alison J., Reed, Daniel C., Wernberg, Thomas., Pérez-Matus, Alejandro., Shears, Nick T., Konar, Brenda, Gagnon, Pat, and Vergés, Adriana. 2014. Kelp Ecosystem Ecology Network Monitoring Handbook. Kelp Ecosystem Ecology Network. For specific data sets, use the following, but also include date the data is accessed from this record in order to track the data version used. Byrnes, Jarrett E.K., Haupt, Alison J., Lyman, Ted. 2014. Kelp forest communities at Appledore Island, the Boston Harbor Islands, and Salem Sound. Kelp Ecosystem Ecology Network. Dijkstra, Jennifer A., Mello, Kristen. 2015. Kelp forest communities at York, Maine. Kelp Ecosystem Ecology Network. Grabwoski, Jonathan and MacMahan, Marissa. 2015. Kelp forest communities in Nahant, Massachusetts, and Pemaquid, Maine. Kelp Ecosystem Ecology Network. Humphries Austin T., Paight C, Ben-Horin Tal, Green Lindsay, Thornber, Carol. 2016. Kelp forest communities in Narragansett Bay, Rhode Island. Kelp Ecosystem Ecology Network. Rasher, Douglass and Price, Nicole. 2017. Kelp forest communities of central and downeast Maine. Kelp Ecosystem Ecology Network. Peréz-Matus, Alejandro and Shaughnessy, Brianna. 2017. Kelp forest communities of central and northern Chile. Kelp Ecosystem Ecology Network.
-
The spatial and temporal dynamics of seagrasses have been studied from the leaf to patch (100 m**2) scales. However, landscape scale (> 100 km**2) seagrass population dynamics are unresolved in seagrass ecology. Previous remote sensing approaches have lacked the temporal or spatial resolution, or ecologically appropriate mapping, to fully address this issue. This paper presents a robust, semi-automated object-based image analysis approach for mapping dominant seagrass species, percentage cover and above ground biomass using a time series of field data and coincident high spatial resolution satellite imagery. The study area was a 142 km**2 shallow, clear water seagrass habitat (the Eastern Banks, Moreton Bay, Australia). Nine data sets acquired between 2004 and 2013 were used to create seagrass species and percentage cover maps through the integration of seagrass photo transect field data, and atmospherically and geometrically corrected high spatial resolution satellite image data (WorldView-2, IKONOS and Quickbird-2) using an object based image analysis approach. Biomass maps were derived using empirical models trained with in-situ above ground biomass data per seagrass species. Maps and summary plots identified inter- and intra-annual variation of seagrass species composition, percentage cover level and above ground biomass. The methods provide a rigorous approach for field and image data collection and pre-processing, a semi-automated approach to extract seagrass species and cover maps and assess accuracy, and the subsequent empirical modelling of seagrass biomass. The resultant maps provide a fundamental data set for understanding landscape scale seagrass dynamics in a shallow water environment. Our findings provide proof of concept for the use of time-series analysis of remotely sensed seagrass products for use in seagrass ecology and management.