 IMAS Metadata Catalogue
Biotic taxonomic identification
Type of resources
Topics
Keywords
Contact for the resource
Provided by
Years
-
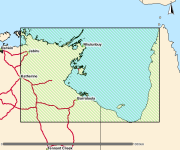
This is a collection of polygons outlining signficant seagrass meadows around Arnhem Land, Kakadu and Gulf of Carpentaria coastal waters for the Northern Australia Marine Biodiversity Survey (NAMBS) project between 2003 and 2005. Data was collected from imagery and ground truthed by observers from helicopter and insitu sample grabs.
-
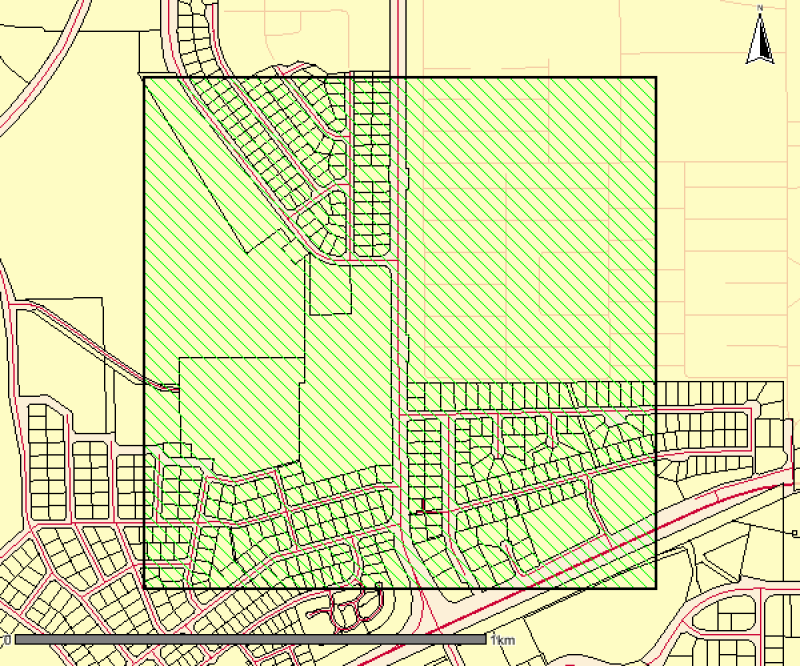
This is a high resolution survey (1:5,000 scale dataset) describing mapped vegetation communities for the Ludmilla Creek catchment area (within the City of Darwin, Northern Territory). (Vegetation Unit - A reasonably homogeneous part of the land surface, distinct from surrounding terrain with constant properties in landform and vegetation) This vegetation survey was undertaken in 1996. This dataset represents the vegetation on the ground at the time of the survey and reflects the data and methods used to create the mapped polygons. The dataset has been revised in 2015 to include community descriptions but has not been updated to reflect the vegetation on the ground. The Darwin Remnant Vegetation Survey is considered a more up-to-date representation of vegetation for this area.
-
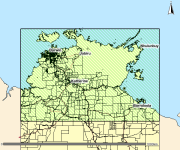
This spatial polygon dataset is derived from the 2001 mapping of mud crab (Scylla serrata) habitats along the NT and Queensland coastal wetlands. The polygons were derived from Landsat imagery and verified with field work and is suitable for use at scale 1:100,000. The information can be used in many ways to assist the management of these habitats. It provides a suitable baseline dataset for monitoring broad scale changes in area and composition of coastal wetland communities. Additionally, it provides information required by managers for choosing representative habitats for protection.
-

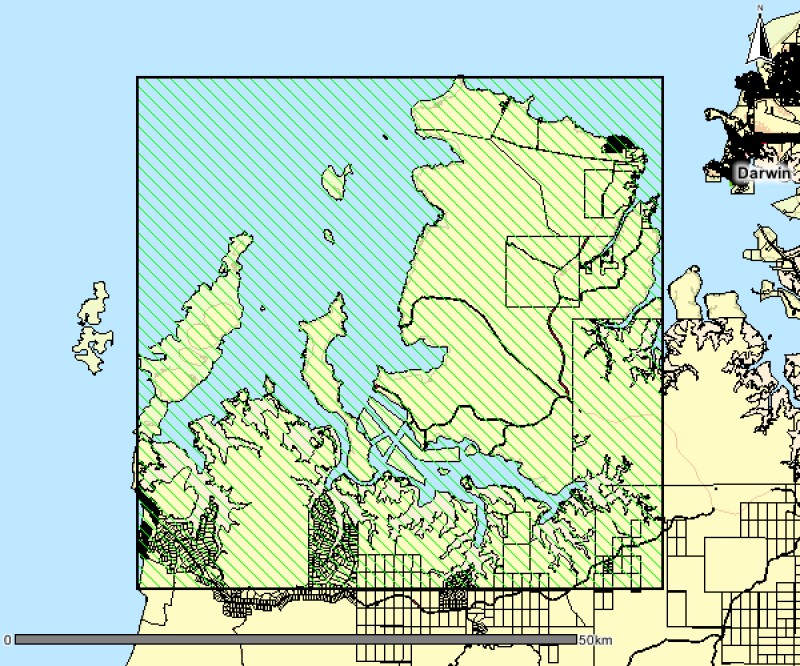
This polygon spatial dataset describes the benthic habitats likely to occur in marine environments around Gunn Point Peninsula and informs the desktop assessment of the marine biodiversity values for the region. The benthic habitats are inferred from existing information but in most cases require further data collection to validate and refine. Habitat modelling forms the basis of benthic community value assessment for Shoal Bay (Galaiduk et al. 2019). The accompanying report Marine and Coastal Biodiversity Assessment of the Gunn Point Area (2020) forms part of the Mapping the Future Project - Gunn Point. This project has identified land capability, water availability and biodiversity values to support land planning and inform development potential over the Gunn Point area. Reports and maps can be viewed from the webpage: denr.nt.gov.au/land-resource-management/development-opportunities - Development Potential of the Gunn Point Area (2020) - Biodiversity Assessment of the Gunn Point Area (2020) - Groundwater Resources of the Gunn Point Area (2020) - Marine and Coastal Biodiversity Assessment of the Gunn Point Area (2020) - Soil and Land Resources of the Gunn Point Area (2020) - Soil and Land Suitability Assessment for Irrigated Agriculture in the Gunn Point Area (2017) - Vegetation Communities of the Gunn Point Area (2020)
-
This polygon spatial dataset describes the mangrove communities for Bynoe Harbour and its environs. The original field survey was undertaken in 1998 at a mapping scale of 1:25,000. The associated report notes an area of approximately 24,000 hectares of mangroves in Bynoe Harbour and describes ten main mangrove associations or communities. The data provides a basis for identifying the extent and distribution of mangrove communities for Bynoe Harbour and its environs. Mangrove mapping was updated over this area in a 2016 survey. See metadata record for Mangrove Community Mapping - Charles Point to Gunn Point. www.ntlis.nt.gov.au/metadata/export_data?type=html&metadata_id=87F656131848A609E050CD9B214417E1
-
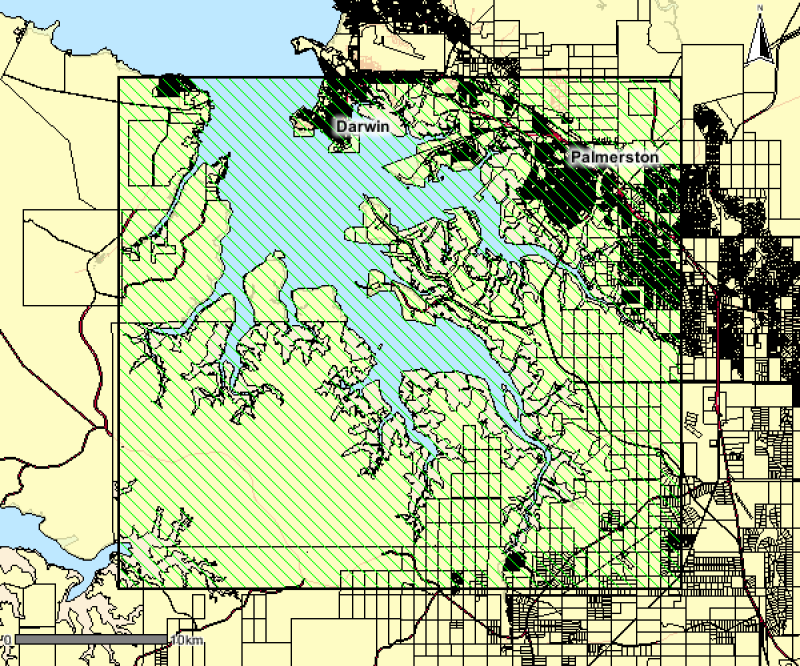
This polygon spatial dataset describes the mangrove communities for Darwin Harbour and its environs and was surveyed at a mapping scale of 1:25 000. The associated report notes an area of approximately 20,400 hectares of mangroves in Darwin Harbour and describes ten main mangrove associations or communities. The data provides a basis for identifying the extent and distribution of mangrove communities for Darwin Harbour and its environs.
-
Spatially referenced underwater video transect data for Tasmanian coastal waters from the LWM (Low water mark) to 80 metres in depth or 1.5 kms from shore.
-

This dataset contains habitat mapping and outer boundaries for estuaries of South Australia. These estuaries were identified in the draft 'Estuaries Policy and Action Plan.' Used to identify the estuarine habitats within South Australia for use in natural resource management and conservaton planning. Description of attributes in related Inventory and Water Quality tables can be found in report: 'Working Towards a State-wide Inventory of Estuaries 2009 - Advancing the inventory of estuaries in five Natural Resource Management Regions of South Australia', DEH and Adelaide Mounty Lofty Ranges NRM Board.
-
This dataset summarises 40 years of seagrass data collection (1983-2022) within Torres Strait and the Gulf of Carpentaria. The full dataset is available through eAtlas at https://doi.org/10.26274/2CR2-JK51 and contains point and polygon packages. This record describes the meadow extent polygons at 641 individual or composite meadows. Managing seagrass resources in northern Australia requires adequate baseline information on where seagrass is (presence/absence), the mapped extent of meadows, what species are present, and date of collection. This baseline is particularly important as a reference point against which to compare seagrass loss or change through time. The scale of northern Australia and the remoteness of many seagrass meadows from human populations present a challenge for research and management agencies reporting on the state of seagrass ecological indicators. Broad-scale and repeated surveys/studies of areas are logistically and financially impractical. However seagrass data is being collected through various projects which, although designed for specific reasons, are amenable to collating a picture of the extent and state of the seagrass resource. In this project we compiled seagrass spatial data collected during surveys in Torres Strait and the Gulf of Carpentaria into a standardised form with point-specific and meadow-specific spatial and temporal information. We revisited, evaluated, simplified, standardised, and corrected individual records, including those collected several decades ago by drawing on the knowledge of one of our authors (RG Coles) who led the early seagrass data collection and mapping programs. We also incorporate new data, such as from photo records of an aerial assessment of mangroves in the Gulf of Carpentaria in 2017. This project was funded by the National Environmental Science Programme (NESP) Marine and Coastal Hub and Torres Strait Regional Authority (TSRA) in partnership with the Centre for Tropical Water and Aquatic Ecosystem Research (TropWATER), James Cook University. The project follows on from TropWATER’s previous work compiling 35 years of seagrass spatial point data and 30 years of seagrass meadow extent data for the Great Barrier Reef World Heritage Area (GBRWHA) and adjacent estuaries, funded through successive NESP Tropical Water Quality Hub Projects 3.1 (2015-2016) and 5.4 (2018-2020). These data sets are now publicly available through the eAtlas data portal: https://doi.org/10.25909/y1yk-9w85 . In making this data publicly available for management, the authors and data custodians request being contacted and involved in decision making processes that incorporate this data, to ensure its limitations are fully understood. Polygons in the meadow layer are drawn from extent data collected during some surveys. Not all surveys collected meadow extent data (e.g., Torres Strait lobster surveys). The seagrass meadow layer is a composite of all the spatial polygon data we could access where meadow boundaries were mapped as part of the survey. All spatial layers were compiled into a single spatial layer using the ArcToolbox ‘merge’ function in ArcMap. Where the same meadow was surveyed multiple times as part of a long-term monitoring program, the overlapping polygons were compiled into a single polygon using the ‘merge’ function in ArcMap. Because meadows surveyed more than once were merged, there were some cases where adjacent polygons overlap each other. Meadow Data Includes: 1. Temporal survey details – Survey month and year, or a list of survey dates for meadows repeatedly sampled; 2. Survey methods; 3. Meadow persistence – Classified into three categories: a. Unknown – Unknown persistence as the meadow was surveyed less than five times; b. Enduring – Seagrass is present in the meadow ≥90% of the surveys; c. Transitory – Seagrass is present in the meadow <90% of the surveys; 4. Meadow depth – Classified into three categories: a. Intertidal – Meadow was mapped on an exposed bank during low tide, e.g. Karumba monitoring meadow; b. Subtidal – Meadow remains completely submerged during spring low tides, e.g. Dugong Sanctuary meadow; c. Intertidal-Subtidal – Meadow includes sections that expose during low tide and sections that remain completely submerged, e.g. meadows adjacent to the Thursday Island shipping channel; 5. Dominant species of the meadow based on the most recent survey; 6. Presence or absence of individual seagrass species in a meadow; 7. Meadow density categories – Seagrass meadows were classified as light, moderate, dense, variable or unknown based on the consistency of mean above-ground biomass of the dominant species among all surveys, or percent cover of all species combined (see Table 2 in Carter et al. 2022). For example, a Halophila ovalis dominated meadow would be classed as “light” if the mean meadow biomass was always <1 gram dry weight m-2 (g DW m-2) among years, “variable” if mean meadow biomass ranged from <1 - >5 g DW m-2, and “dense” if mean meadow biomass was always >5 g DW m-2 among years. For meadows with density assessments based on both percent cover (generally from older surveys) and biomass, we assessed density categories based on the biomass data as this made the assessment comparable to a greater number of meadows, and comparable to the most recent data. Meadows with only one year of data were assigned a density category based on that year but no assessment of variability could be made and these are classified as “unknown”; 8. The minimum and maximum annual mean above-ground biomass measured in g DW m-2 (+ standard error if available) for each meadow is included for meadows with >1 year of biomass data. For meadows that were only surveyed once the mean meadow biomass (+ standard error if available) is presented as the minimum and maximum biomass of the meadow. “-9999” represents meadows where no above-ground biomass data was collected.; 9. The minimum and maximum annual mean percent cover is included for each meadow with >1 year of percent cover data. For meadows that were only surveyed once the mean meadow percent cover is presented as the minimum and maximum percent cover of the meadow. Older surveys (e.g., 1986 Gulf of Carpentaria surveys) used percent cover rather than biomass. For some surveys percent cover was estimated as discrete categories or ‘data binning’ (e.g., <10% - >50%). “-9999” represents meadows where no percent cover data was collected; 10. Meadow area survey details – The minimum, maximum and total area (hectares; ha) for each meadow: a. Total area - Total area of each meadow was estimated in the GDA 1994 Geoscience Australia Lambert projection using the ‘calculate geometry’ function in ArcMap. For meadows that were mapped multiple times, meadow area represents the merged maximum extent for all surveys. 11. Minimum and maximum area – For meadows surveyed more than once the minimum and maximum annual area of the meadow was reported. For meadows that were only surveyed once the meadow area is presented as the minimum and maximum area of the meadow. Where possible, we retained area data reported in the original shapefiles (and calculated using original projections). Where area data did not exist in original shapefiles (e.g., 1986 Gulf of Carpentaria surveys), we calculated area using the ‘calculate geometry’ function in ArcMap in the GDA 1994 Geoscience Australia Lambert projection; Data custodians. Spatial Limits: Data was limited to that collected in the Gulf of Carpentaria between Cape Arnhem (Northern Territory) and Cape York (Queensland). Torres Strait data was restricted to north of Queensland’s Great Barrier Reef World Heritage Area boundary, and includes data collected along the Papua New Guinea coastline. Taxonomy: Seagrass taxonomic revision over the last couple of decades has resulted in the revision and reclassification of some tropical species. For example, Zostera capricorni has been reclassified as Zostera muelleri subsp. capricorni, Halophila minor a synonym of Halophila ovalis, and Halodule pinifolia a synonym of Halodule uninervis. Field surveys have at times grouped species that are difficult to distinguish in the field. To address these issues, we amalgamated some species into complexes: Halophila minor and Halophila ovalis are included as Halophila ovalis complex. Zostera muelleri subsp. capricorni has been abbreviated to Zostera capricorni throughout for simplicity. Data Sets: Data was limited to that collected in the Gulf of Carpentaria between Cape Arnhem (Northern Territory) and Cape York (Queensland). Torres Strait data was restricted to north of Queensland’s Great Barrier Reef World Heritage Area boundary, and includes data collected along the Papua New Guinea coastline. Further information in the data sets included in this synthesis can be found in this report: Carter A, McKenna S, Rasheed M, Taylor H, van de Wetering C, Chartrand K, Reason C, Collier C, Shepherd L, Mellors J, McKenzie L, Roelofs A, Smit N, Groom R, Barrett D, Evans S, Pitcher R, Murphy N, Duke NC, Carlisle M, David M, Lui S, Torres Strait Indigenous Rangers (led by Pearson L, Laza T, Bon A), and Coles RG (2022). Four Decades of Seagrass Spatial Data from Torres Strait and Gulf of Carpentaria. Report to the National Environmental Science Program. Centre for Tropical Water and Aquatic Ecosystem Research (TropWATER), James Cook University. Limitations of the Data: Data included extends back to the mid-1980s. Large parts of the coast have not been mapped for seagrass presence since that time. Technology and methods for mapping and position fixing have improved dramatically in 40 years. This layer represents the most reliable interpretation of that early data. Not all surveys collected meadow data, including Torres Strait lobster and beche de mer surveys and Torres Strait intertidal transect monitoring collected only site data. Because of this, the meadow layer represents an underestimate of seagrass extent, particularly in deeper subtidal waters. The meadow layer should be used in conjunction with the site layer to determine where meadows have been mapped, and where seagrass surveys have occurred but no seagrass has been found. See Table 1 and Data age, Limitations and Variability section in Carter et al. (2022). Data Dictionary: Torres Strait and Gulf of Carpentaria seagrass meadows, 1984-2022 (polygon data) - ID (numeric) - Unique identifier representing a single meadow - SURVEY_NAME (text) – Name of survey location - SURVEY_DATE (text) – A list of survey date(s) for meadows repeatedly sampled; month and year - PERSISTENCE (text) – Meadow form on three categories: enduring, transitory, unknown - DEPTH (text) – Classified into three categories (intertidal, subtidal, intertidal-subtidal) - DENSITY (text) – Meadow density categories (light, moderate, dense, variable, unknown) - AREA (text) - Area of the composite meadow in a given location in hectares, represents merged maximum extent - SURVEY METHOD (text) – e.g., helicopter, walking, hovercraft, boat-based including camera, free diving, scuba diving, van Veen grab, sled net - COMMENTS (text) – Any comments for that site - CUSTODIAN (text) – Custodian/owner of the data set - NO_SURVEYS (numeric) – Number of times meadow has been surveyed - DOMINANT_SPP [DOM_SPP] (text) – The dominant species in the meadow - EA_PA (numeric) – Absence (0) or Presence (1) of Enhalus acoroides - TC_PA (numeric) – Absence (0) or Presence (1) of Thalassodendron ciliatum - TH_PA (numeric) – Absence (0) or Presence (1) of Thalassia hemprichii - CS_PA (numeric) – Absence (0) or Presence (1) of Cymodocea serrulata - CR_PA (numeric) – Absence (0) or Presence (1) of Cymodocea rotundata - ZC_PA (numeric) – Absence (0) or Presence (1) of Zostera muelleri subsp. capricorni - HU_PA (numeric) – Absence (0) or Presence (1) of Halodule uninervis - SI_PA (numeric) – Absence (0) or Presence (1) of Syringodium isoetifolium - HS_PA (numeric) – Absence (0) or Presence (1) of Halophila spinulosa - HT_PA (numeric) – Absence (0) or Presence (1) of Halophila tricostata - HO_PA (numeric) – Absence (0) or Presence (1) of Halophila ovalis - HC_PA (numeric) – Absence (0) or Presence (1) of Halophila capricorni - HD_PA (numeric) – Absence (0) or Presence (1) of Halophila decipiens - BIO_MIN (numeric) – The minimum mean meadow biomass measured in g DW m-2 for meadows sampled more than once, or -9999 where biomass data not recorded - BIO_MIN_SE (numeric) – Standard error of the minimum mean meadow biomass measured in g DW m-2, or -9999 where biomass data not recorded - BIO_MAX (numeric) – The maximum mean meadow biomass measured in g DW m-2 for meadows sampled more than once, or -9999 where biomass data not recorded - BIO_MAX_SE (numeric) – Standard error of the maximum mean meadow biomass measured in g DW m-2, or -9999 where biomass data not recorded - PER_CO_MIN (numeric) – The minimum mean meadow percent cover for meadows sampled more than once, or -9999 where percent cover data not recorded - PER_CO_MAX (numeric) – The maximum meadow percent cover for meadows sampled more than once, or -9999 where percent cover data not recorded - AREA_MIN (numeric) – The minimum area for meadows sampled more than once - AREA_MAX (numeric) – The maximum area for meadows sampled more than once
-
The National Reef Monitoring Network brings together shallow reef surveys conducted around Australia into a centralised database. The IMOS National Reef Monitoring Network sub-Facility collates, cleans, stores and makes this data rapidly available from contributors including: Reef Life Survey, Parks Australia, Department of Biodiversity, Conservation and Attractions (Western Australia), Department of Environment, Water and Natural Resources (South Australia), Department of Primary Industries (New South Wales), Tasmanian Parks and Wildlife Service and Parks Victoria. The data provided by the National Reef Monitoring Network contributes to establishing and supporting national marine baselines, and assisting with the management of Commonwealth and State marine reserves. Reef Life Survey (RLS) and the Australian Temperate Reef Network (ATRC) aims to improve biodiversity conservation and the sustainable management of marine resources by coordinating surveys of rocky and coral reefs using scientific methods, with the ultimate goal to improve coastal stewardship. Our activities depend on the skills of marine scientists, experienced and motivated recreational SCUBA divers, partnerships with management agencies and university researchers, and active input from the ATRC partners and RLS Advisory Committee. RLS and ATRC data are freely available to the public for non-profit purposes, so not only managers, but also groups such as local dive clubs or schools may use these data to look at changes over time in their own local reefs. By making data freely available and through public outputs, RLS and ATRC aims to raise broader community awareness of the status of Australia’s marine biodiversity and associated conservation issues.