 IMAS Metadata Catalogue
MACROALGAE (SEAWEEDS)
Type of resources
Topics
Keywords
Contact for the resource
Provided by
Years
-
This dataset contains raw RNA sequencing reads from juvenile Ecklonia radiata (Laminariales) collected from Bruny Island, Tasmania, and used in a controlled laboratory heatwave experiment. Individuals were exposed to ambient, single, or repeated marine heatwave treatments to assess the effects of thermal stress and recovery. Total RNA was extracted from blade tissue and sequenced on an Illumina platform to generate paired-end reads. The data represent high-quality raw FASTQ files (n = 30 samples; 5 replicates per treatment per time point) suitable for transcriptomic analyses examining the molecular responses of E. radiata to marine heatwaves.
-
This dataset contains raw RNA sequencing reads from juvenile Ecklonia radiata (Laminariales) collected from Coal Point, Tasmania, and used in a controlled laboratory experiment examining the effects of temperature and elevated CO₂ on gene expression. Individuals were exposed to three temperatures (6, 16, and 26 °C) under two CO₂ levels: current (~420 µatm) and future (~1000 µatm), representing RCP 8.5 projections. Total RNA was extracted from blade tissue and sequenced on an Illumina NovaSeq 6000 platform to produce 150 bp paired-end reads. The dataset includes raw FASTQ files from 30 biological samples (n = 5 per treatment combination) used for transcriptomic analyses investigating the molecular responses of E. radiata to ocean warming and acidification.
-
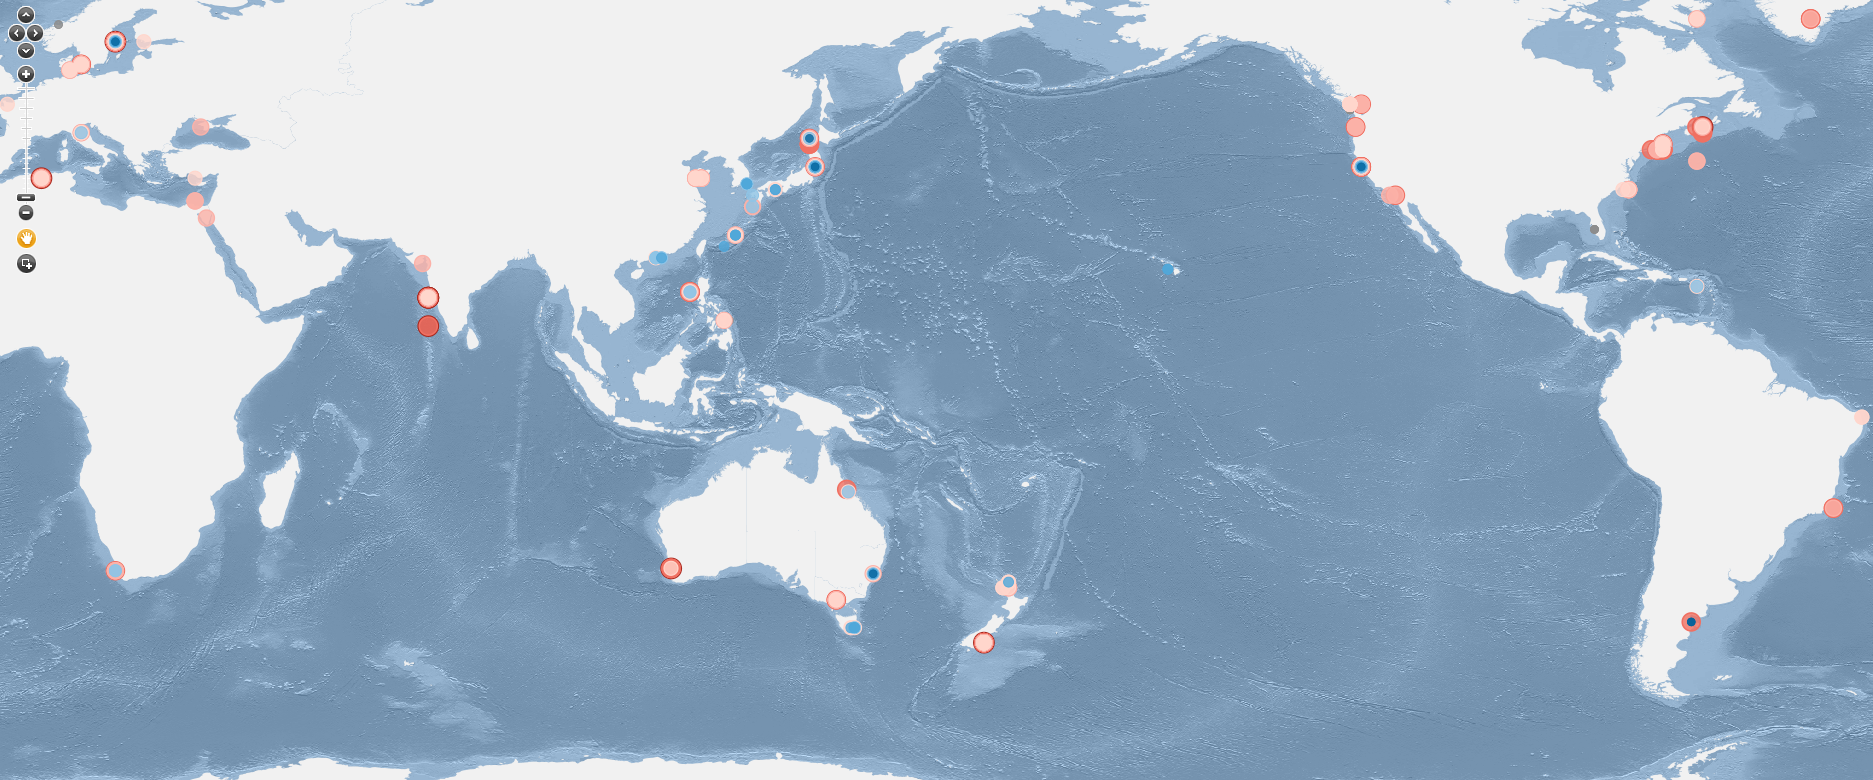
This data was collected and analysed for the project "Dissolved inorganic nitrogen uptake by seaweeds: a global analysis" published in Botanica Marina. Data was compiled between May 2025 and July 2025 from published studies on the uptake kinetics of nitrate (NO₃⁻) and ammonium (NH₄⁺) by marine macroalgae i.e. the rate of Dissolved Inorganic Nitrogen (DIN) uptake rate at a range of DIN concentrations. Each study contained values for the Michaelis-Menten kinetic constants maximum uptake rate (Vmax) and the half saturation constant (Ks), linear uptake gradients, or described biphasic uptake patterns. A total of 84 published studies presenting this data were discovered, with 556 distinct data entries. The project examined DIN uptake rates in marine macroalgae by Phylum, order, experimental irradiance and temperature, geographic location and functional group. Articles were identified through searches on Google Scholar and Web of Science, with all studies reporting Michaelis-Menten kinetic constants or linear uptake slopes included. For each study, we recorded taxonomic information, functional group, the experimental subject (species and algal tissue used), habitat of origin (subtidal, intertidal, or cultured), and season of collection. We also documented experimental conditions, including temperature, irradiance, DIN source (nitrate or ammonium), presence and concentration of other macronutrients (e.g., phosphate or non-target DIN), and the phosphate:DIN ratio of the culture medium. Where available, we extracted kinetic parameters (Vmax, Ks/Km), linear uptake slopes, uptake pattern (saturating, linear, or biphasic), maximum DIN concentration tested, the range of concentrations used in multi-flask experiments, and the time interval over which uptake was measured (for time-course experiments). Geographic coordinates of the study location were also recorded. Each study entry in this dataset includes the full study reference (author and year) and a functional DOI where available (as of November 2025).
-
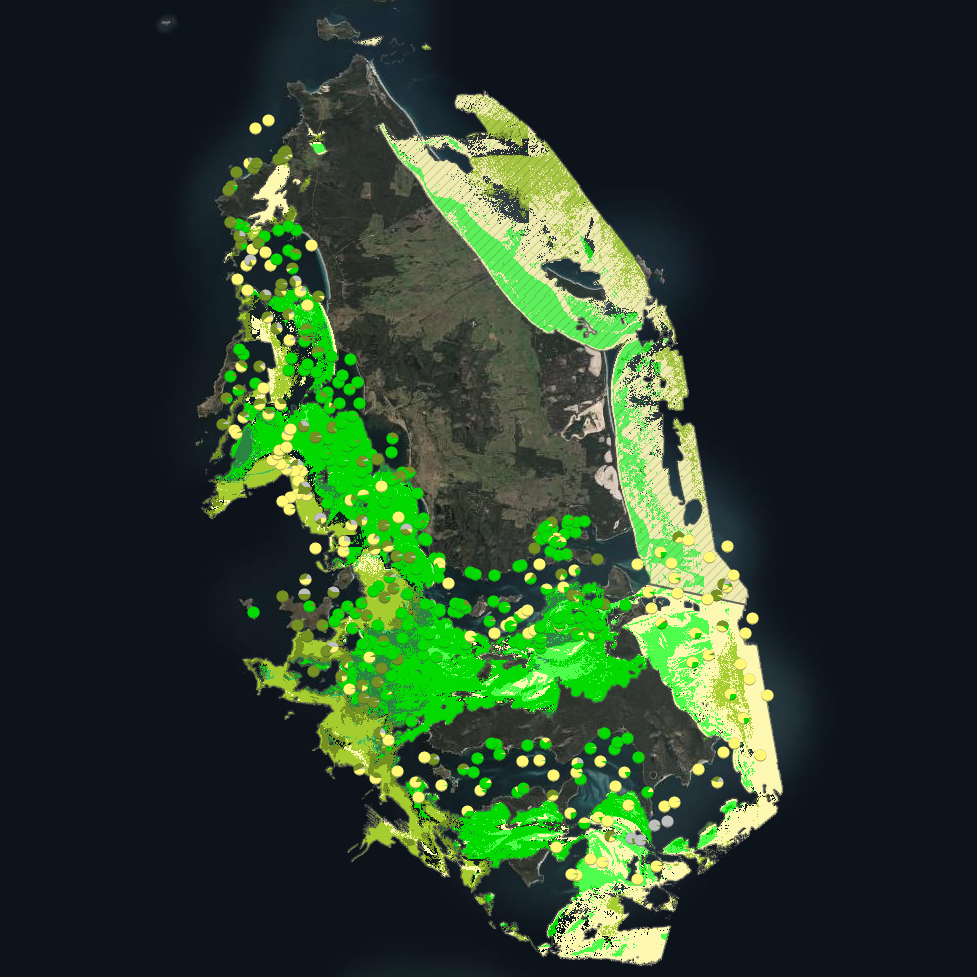
***This record contains a subset of benthic habitat data from https://doi.org/10.25959/E4S6-GE74 (NESP MaC Project 3.6) rehosted for the purposes of the Seamap Australia collaborative project.*** Seagrass beds are a dominant marine ecosystem of Tayaritja (the Furneaux Group of Islands) in the north-eastern waters off Tasmania. Historical coarse mapping has indicated extensive beds of Posidonia, Amphibolis, Heterozostera, and Zostera species, potentially comprising some of the largest and deepest seagrass extents found in temperate Australian waters. However, limited data on the distribution and ecological value of these seagrass habitats represents a significant knowledge gap in understanding Australia's wetland natural assets. This project mapped the extent, ecological composition, population structure, and blue carbon value of seagrass beds around Tayaritja, in partnership with the Tasmanian Aboriginal Centre, as part of NESP Marine and Coastal Hub Project 3.6. The study area focused on the coastal waters surrounding Flinders Island in the western Furneaux Group, with mapping extending from the high tide line to the depth limit of reliable optical detection (approximately 30 m), based on analysis of field data and satellite imagery capabilities in the region. This metadata record specifically describes the benthic mapping component of the study. A combination of close-range remote sensing methods was used to map the extent and ecological values of seagrass beds. High-resolution satellite imagery from Sentinel-2 (10 m) sensors, combined with bathymetric LiDAR data and oceanographic variables, was used to map baseline seagrass extent and composition. A field campaign deployed a Benthic Observation Survey System (BOSS) and unBaited Remote Underwater stereo-Video system (stereo-uBRUV) at approximately 400 locations to validate remote sensing outputs, collecting field photo quadrats and rhizome cores. From these data, maps were produced showing the extent and coverage of seagrass, sand, and macroalgae, and where possible, seagrass species composition, subject to water depth and clarity constraints. See the "Lineage" section of this record for full methodology.
-
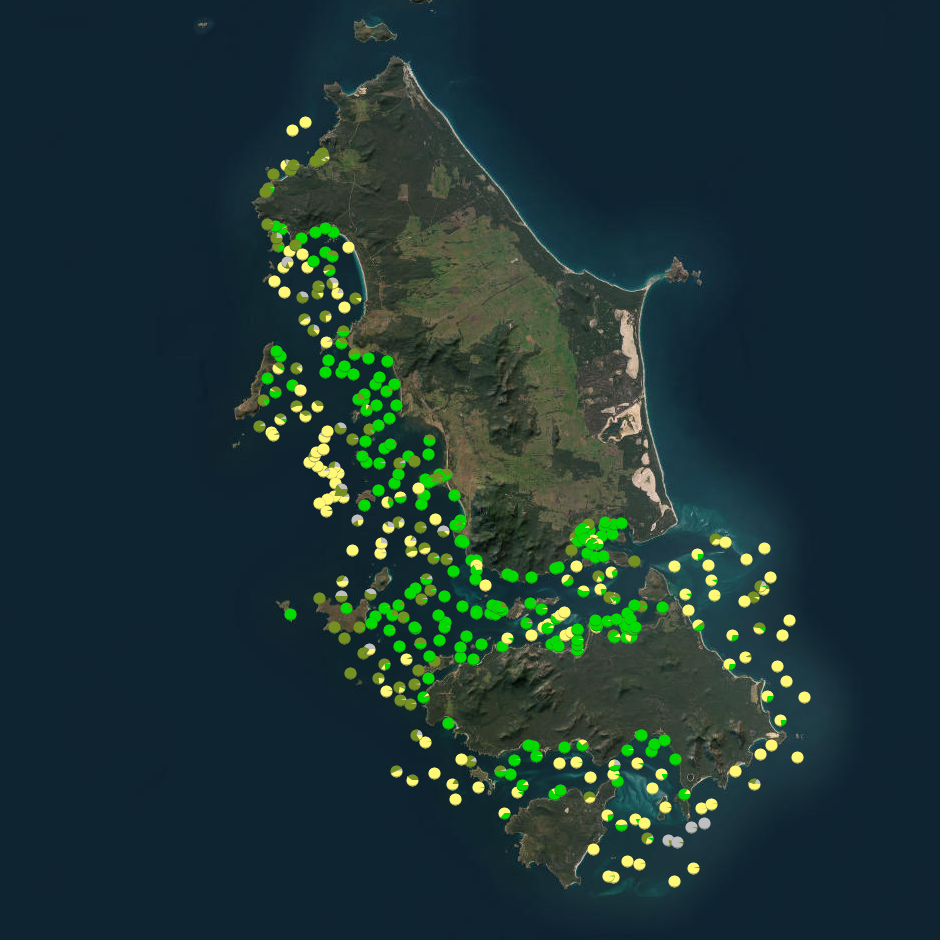
Seagrass beds are a dominant marine ecosystem of Tayaritja (the Furneaux Group of Islands) in the north-eastern waters off Tasmania. Historical coarse mapping has indicated extensive beds of Posidonia, Amphibolis, Heterozostera, and Zostera species, potentially comprising some of the largest and deepest seagrass extents found in temperate Australian waters. However, limited data on the distribution and ecological value of these seagrass habitats represents a significant knowledge gap in understanding Australia's wetland natural assets. This project mapped the extent, ecological composition, population structure, and blue carbon value of seagrass beds around Tayaritja. The study area focused on the coastal waters surrounding Flinders Island in the western Furneaux Group, with mapping extending from the high tide line to the depth limit of reliable optical detection (approximately 30 m), based on analysis of field data and satellite imagery capabilities in the region. The field validation component of this study involved deployment of benthic video platforms to capture imagery of seagrass beds and associated ecosystems. A field campaign deployed a Benthic Observation Survey System (BOSS) and unBaited Remote Underwater stereo-Video system (stereo-uBRUV) at approximately 400 locations to collect photoquadrats and validate remote sensing outputs. Imagery annotation was conducted in the SQUIDLE+ platform. The approach developed through this study contributed to the creation of the NESP Standard Operating Procedure (SOP) for Seagrass Mapping using Optical Remote Sensing (https://sustainabledevelopmentreform.github.io/nesp-sop-seagrass-mapping).. See the "Lineage" section of this record for full methodology of field collection techniques. See associated dataset https://doi.org/10.25959/e4s6-ge74 for habitat maps derived from field validation and remote sensing inputs.
-
Kelps are in global decline due to climate change, including ocean warming. To identify vulnerable species, we need to identify their tolerances to increasing temperatures and whether tolerances are altered by co-occurring drivers such as inorganic nutrient levels. This is particularly important for those with restricted distributions, which may already be experiencing thermal stress. To identify thermal tolerance of the range restricted kelp Lessonia corrugata, we conducted a laboratory experiment on juvenile sporophytes to measure performance (growth, photosynthesis) across its thermal range (4 – 22 °C). We found the upper thermal limit for growth and photosynthesis to be ~ 22 – 23 °C, with an optimum of ~ 16 °C. To determine if elevated inorganic nitrogen availability could enhance thermal tolerance, we compared performance of juveniles under low (4.5 µmol/day) and high (90 µmol/day) nitrate conditions at and above the thermal optimum (16 – 23.5 °C). Nitrate enrichment did not enhance thermal performance at temperatures above the optimum but did lead to elevated growth rates at the thermal optimum 16 °C. Our findings indicate L. corrugata is likely to be extremely susceptible to moderate ocean warming and marine heatwaves. Peak sea surface temperatures during summer in eastern and northeastern Tasmania can reach up to 20 – 21 °C and climate projections suggest that L. corrugata’s thermal limit will be regularly exceeded by 2050 as south-eastern Australia is a global ocean-warming hotspot. By identifying the upper thermal limit of L. corrugata we have taken a critical step in predicting the future of the species in a warming climate.
-

Seagrass beds are a dominant marine ecosystem of Tayaritja (the Furneaux Group of Islands) in the north-eastern waters off Tasmania. Historical coarse mapping has indicated extensive beds of Posidonia, Amphibolis, Heterozostera, and Zostera species, potentially comprising some of the largest and deepest seagrass extents found in temperate Australian waters. However, limited data on the distribution and ecological value of these seagrass habitats represents a significant knowledge gap in understanding Australia's wetland natural assets. This project mapped the extent, ecological composition, population structure, and blue carbon value of seagrass beds around Tayaritja, in partnership with the Tasmanian Aboriginal Centre. The study area focused on the coastal waters surrounding Flinders Island in the western Furneaux Group, with mapping extending from the high tide line to the depth limit of reliable optical detection (approximately 30 m), based on analysis of field data and satellite imagery capabilities in the region. This record specifically describes the benthic mapping component of the study. See https://doi.org/10.25959/WRXK-KV06 for imagery annotation data from the field validation campaigns. A combination of close-range remote sensing methods was used to map the extent and ecological values of seagrass beds. The approach developed through this study contributed to the creation of the NESP Standard Operating Procedure (SOP) for Seagrass Mapping using Optical Remote Sensing (https://sustainabledevelopmentreform.github.io/nesp-sop-seagrass-mapping).. High-resolution satellite imagery from Sentinel-2 (10 m) sensors, combined with bathymetric LiDAR data and oceanographic variables, was used to map baseline seagrass extent and composition. A field campaign deployed a Benthic Observation Survey System (BOSS) and unBaited Remote Underwater stereo-Video system (stereo-uBRUV) at approximately 400 locations to validate remote sensing outputs. From these data, maps were produced showing the extent and coverage of seagrass, sand, and macroalgae, and where possible, seagrass species composition, subject to water depth and clarity constraints. See the "Lineage" section of this record for full methodology. Three key types of mapping products were developed: ---Occurrence probability maps--- Continuous probability surfaces (0-100%), modelled from presence/absence data, indicating the likelihood of habitat presence at each pixel for: • Seagrass (all morphologies; > 5% cover observed in underwater field imagery) • Macroalgae species/assemblages • Sand ---Habitat percentage cover maps--- Quantitative estimates of percent cover for each habitat category: • Seagrass (all morphologies) • Macroalgae species/assemblages • Sand ---Derived products--- • Baseline binary presence/extent maps derived from optimised probability thresholds: ○ Seagrass: sgprob > 0.5 & sgprob > macroprob & sandcover < 0.9 ○ Macroalgae: macroprob > 0.5 & macroprob > sgprob & sandcover < 0.9 ○ Sand: sandprob > 0.5 & sandcover < 0.2 • Predicted seagrass species composition of binary extent map. • Fractional cover visualisation: combining cover percentages of multiple habitats into a single composite product • Composite habitat maps: combining binary habitat extents and delineating mixed habitat classes These complementary products serve different purposes: probability maps provide confidence measures, extent maps delineate habitat boundaries, percent cover maps support quantitative analysis of habitat density patterns, and composite habitat maps represent the diversity of mixed habitat classes. Together, they provide a comprehensive understanding of seagrass and associated habitat distribution across the study area.
-
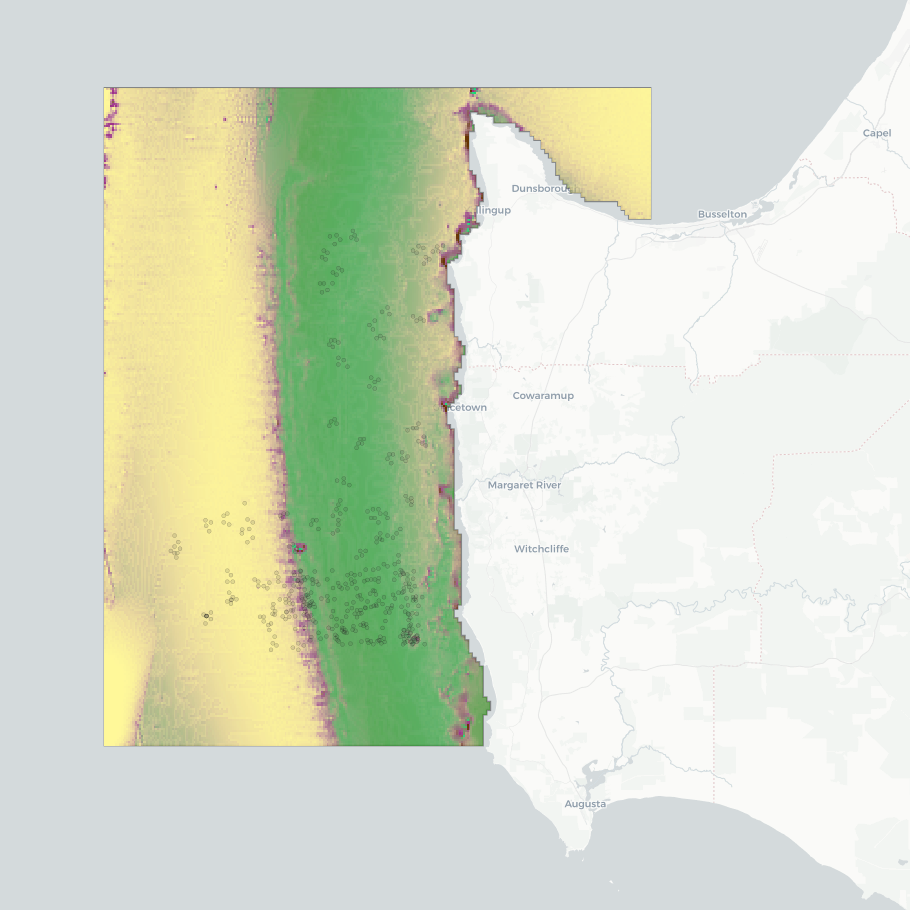
This dataset presents the results of a seafloor habitat modeling exercise for the 'Capes region' of the South-west Corner Marine Park, southern WA. The model classifies five broad habitat types (hereafter 'ecosystem components'): seagrass, macroalgae, sessile invertebrates, bare consolidated substrata, and bare unconsolidated substrata. Modeling was conducted at two spatial scales to assess the effectiveness of using broad-scale (~250 m) spatial covariates derived from bathymetry in mapping habitat classes and to compare the modelling outcomes with those obtained using finer-resolution input data. The fine-scale mapping focused on an IUCN II zone near Margaret River, using a seamless 5 m resolution multibeam bathymetry composite. The broad-scale mapping covered multiple IUCN zones, including the southwestern Geographe Australian Marine Park (AMP), the northwestern tip of the South-west Corner AMP, and the Ngari Capes WA State Marine Park. This component used the 250 m resolution 2023 AusBathyTopo grid from Geoscience Australia. Habitat maps were constructed using (1) the bathymetry data sources described above; (2) ground-truthing observations from stereo-BRUV and BOSS camera systems; and (3) Physical covariates, all smoothed to 5 m or 250 m resolution, for the fine- and broad-scale mapping, respectively. Source datasets are available from: • Geoscience Australia's eCat: https://dx.doi.org/10.26186/145281 (5 m multibeam bathymetry) and https://doi.org/10.26186/148758 (250 m DEM bathymetry) • Squidle+: http://squidle.org/geodata/explore (benthic imagery annotations - see also outputs from NESP MaC Project 2.4: https://doi.org/10.25959/6G5A-3G03) • AODN Portal: https://portal.aodn.org.au/search (IMOS oceanographic datasets). This analysis uses the modelling methodology developed in NESP Project 2.1, which extended the ecosystem component modelling to include all temperate Australian shelf waters at a resolution of 250 m (https://doi.org/10.25959/BVJ7-D984). Analysing the scale effects effects of spatial covarariate inputs was undertaken by NESP Project 2.3, along with exploration of visualisation options regarding prediction certainty in consultation with Parks Australia (management end-users). Further details on sampling design for ground-truthing observations and the modelling techniques are available in the NESP MaC Project 2.1 Final Report: https://www.nespmarinecoastal.edu.au/publication/improving-seabed-habitat-predictions-for-southern-australia. A description on this specific South-west Corner case study and the spatial scale analysis is described in the NESP MaC Project 2.3 Final Report: https://www.nespmarinecoastal.edu.au/publication/improving-knowledge-transfer-to-support-australian-marine-park-decision-making-and-management-effectiveness-evaluation. A selection of mapping (WMS) services are listed in the 'Downloads & Links' section of this record. See the 'Lineage' section for a full description of the data packages available for download, and for more visualisation options.
-
The data is quantitative abundance of fish, megafaunal invertebrates and percent algal cover derived from underwater visual census methods involving transect counts at rocky reef sites around Tasmania. This dataset allows examination of changes in Tasmanian shallow reef faunal and floral communities over a decadal scale, with initial surveys conducted in 1992-1995, and again in 2006-2007. There are plans for ongoing surveys. An additional component was added in the latter study - a boat ramp study looking at the proximity of boat ramps and their effects of fishing. We analysed underwater visual census data on fishes and macroinvertebrates (abalone and rock lobsters) at 133 shallow rocky reef sites around Tasmania that ranged from 0.6 - 131 km from the nearest boat ramp. These sites were not all the same as those used for the comparison of 1994 and 2006 reef communities. The subset of 133 sites examined in this component consisted of only those sites that were characterized by the two major algal (kelp) types (laminarian or fucoid dominated). Sites with atypical algal assemblages were omitted from the 196 sites surveyed in 2006. This study aimed to examine reef community data for changes at the community level, changes in species richness and introduced species populations, and changes that may have resulted from ocean warming and fishing. The methods are described in detail in Edgar and Barrett (1997). Primarily the data are derived from transects at 5 m depth and/or 10 m depth at each site surveyed. The underwater visual census (UVC) methodology used to survey rocky reef communities was designed to maximise detection of (i) changes in population numbers and size-structure (ii) cascading ecosystem effects associated with disturbances such as fishing, (iii) long term change and variability in reef assemblages.
-
The data is quantitative abundance of fish and megafaunal invertebrates and algal % cover derived from transect based counts at a wide range of locations across Temperate Australia. The methods are described in detail in Edgar and Barrett (1997). Primarily the data are derived from transects at 5 m depth and/or 10 m depth at each site surveyed. Methods were initially developed for research on temporal changes following protection in Tasmanian long-term MPAs (Maria Is, Tinderbox, Ninepin Point, Governor Island), and the data represented by this record has been collected at Tinderbox. In many cases the dataset involves temporal replication (year scale), particularly for the core Tasmanian MPAs represented by this record.