IMAS Metadata Catalogue
Testing the effects of scale on benthic habitat modelling in the South-west Corner Marine Park (NESP MaC 2.3)
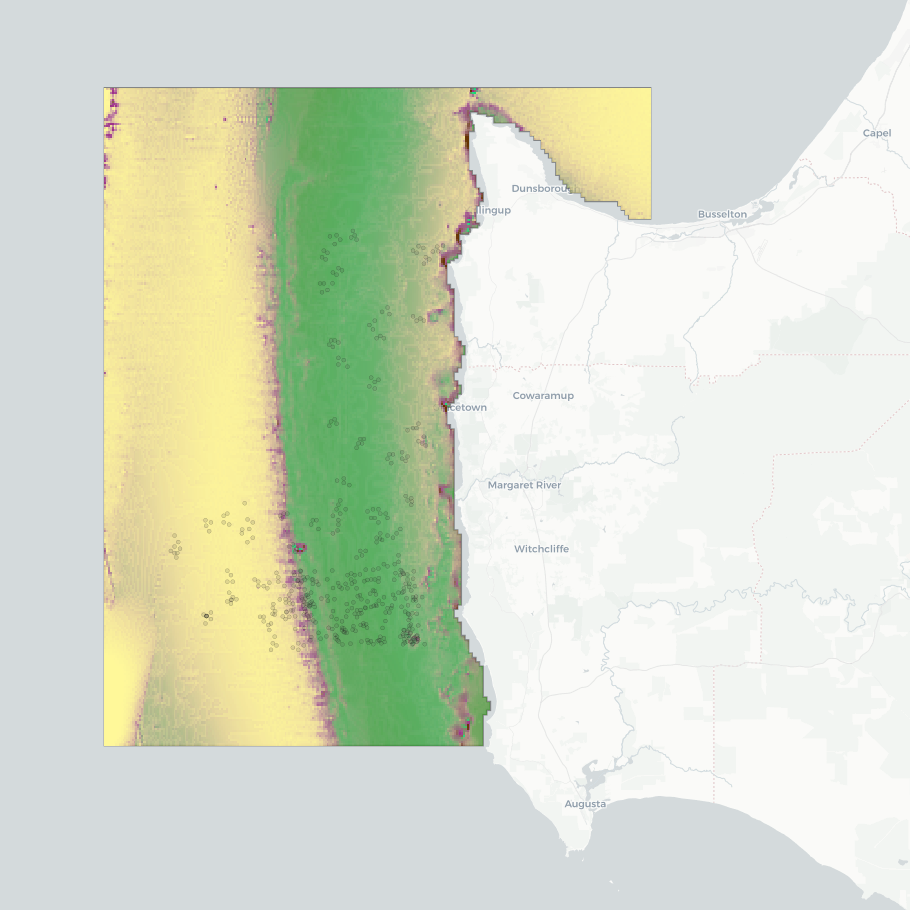
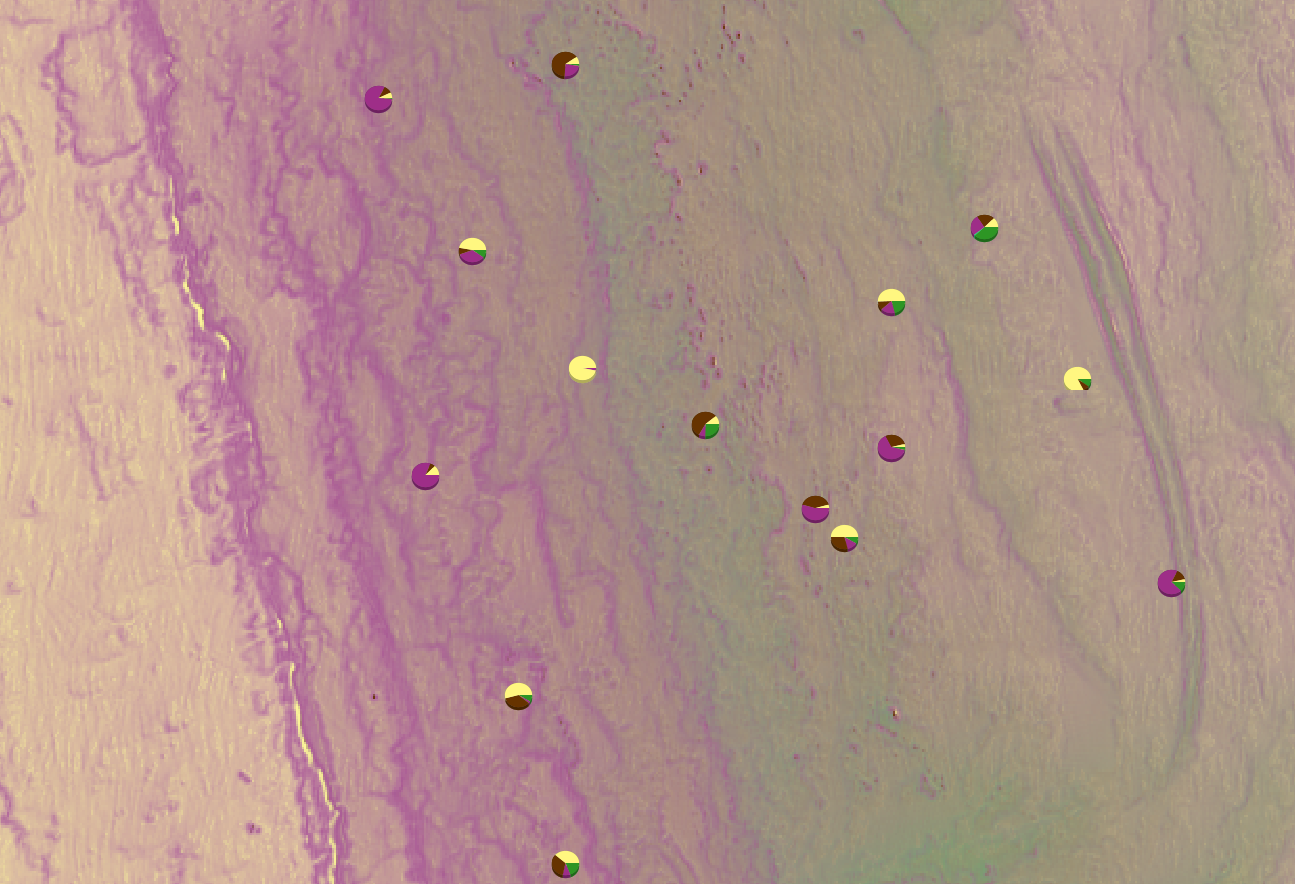
This dataset presents the results of a seafloor habitat modeling exercise for the 'Capes region' of the South-west Corner Marine Park, southern WA. The model classifies five broad habitat types (hereafter 'ecosystem components'): seagrass, macroalgae, sessile invertebrates, bare consolidated substrata, and bare unconsolidated substrata. Modeling was conducted at two spatial scales to assess the effectiveness of using broad-scale (~250 m) spatial covariates derived from bathymetry in mapping habitat classes and to compare the modelling outcomes with those obtained using finer-resolution input data.
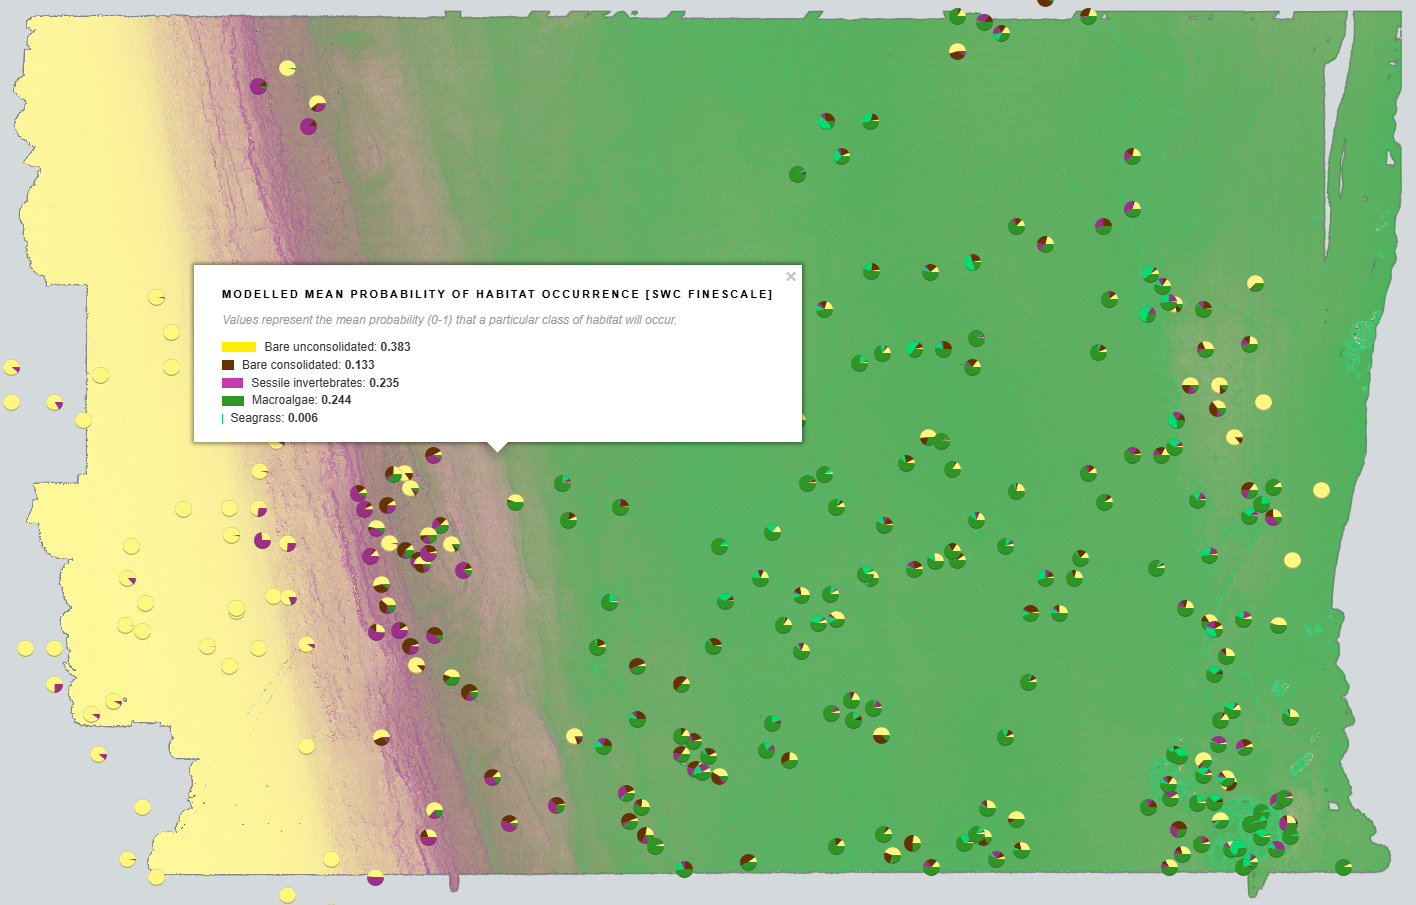
The fine-scale mapping focused on an IUCN II zone near Margaret River, using a seamless 5 m resolution multibeam bathymetry composite. The broad-scale mapping covered multiple IUCN zones, including the southwestern Geographe Australian Marine Park (AMP), the northwestern tip of the South-west Corner AMP, and the Ngari Capes WA State Marine Park. This component used the 250 m resolution 2023 AusBathyTopo grid from Geoscience Australia.
Habitat maps were constructed using
(1) the bathymetry data sources described above;
(2) ground-truthing observations from stereo-BRUV and BOSS camera systems; and
(3) Physical covariates, all smoothed to 5 m or 250 m resolution, for the fine- and broad-scale mapping, respectively.
Source datasets are available from:
• Geoscience Australia's eCat: https://dx.doi.org/10.26186/145281 (5 m multibeam bathymetry) and https://doi.org/10.26186/148758 (250 m DEM bathymetry)
• Squidle+: http://squidle.org/geodata/explore (benthic imagery annotations - see also outputs from NESP MaC Project 2.4: https://doi.org/10.25959/6G5A-3G03)
• AODN Portal: https://portal.aodn.org.au/search (IMOS oceanographic datasets).
This analysis uses the modelling methodology developed in NESP Project 2.1, which extended the ecosystem component modelling to include all temperate Australian shelf waters at a resolution of 250 m ( https://doi.org/10.25959/BVJ7-D984). Analysing the scale effects effects of spatial covarariate inputs was undertaken by NESP Project 2.3, along with exploration of visualisation options regarding prediction certainty in consultation with Parks Australia (management end-users). Further details on sampling design for ground-truthing observations and the modelling techniques are available in the NESP MaC Project 2.1 Final Report: https://www.nespmarinecoastal.edu.au/publication/improving-seabed-habitat-predictions-for-southern-australia. A description on this specific South-west Corner case study and the spatial scale analysis is described in the NESP MaC Project 2.3 Final Report: https://www.nespmarinecoastal.edu.au/publication/improving-knowledge-transfer-to-support-australian-marine-park-decision-making-and-management-effectiveness-evaluation.
A selection of mapping (WMS) services are listed in the 'Downloads & Links' section of this record. See the 'Lineage' section for a full description of the data packages available for download, and for more visualisation options.
Simple
Identification info
- Date (Creation)
- 2024-05-13
Identifier
- Title
- Information and documentation - Digital object identifier system
- Citation identifier
- ISO 26324:2012
- Code
- 10.25959/2RKJ-H521
- Codespace
- doi.org
- Description
- Digital Object Identifier (DOI)
Principal investigator
Collaborator
Collaborator
Contributor
- Credit
- The data collections described in this record are funded by the Australian Government Department of Climate Change, Energy, the Environment and Water (DCCEEW) through the NESP Marine and Coastal Hub. In addition to NESP (DCCEEW) funding, this project is matched by an equivalent amount of in-kind support and co-investment from project partners and collaborators.
- Credit
- In addition to NESP (DCCEEW) funding, this project is matched by an equivalent amount of in-kind support and co-investment from project partners and collaborators.
- Status
- Completed
Point of contact
Point of contact
- Topic category
-
- Biota
- Environment
Extent

Temporal extent
- Time period
- 2020-01-01 2024-01-30
Vertical element
- Minimum value
- 10
- Maximum value
- 250
- Identifier
- EPSG::5715
- Name
- MSL depth
- Maintenance and update frequency
- Not planned
Resource format
- Date
- Keywords (Project)
-
- National Environmental Science Program (NESP) Marine and Coastal Hub
- NASA/GCMD Keywords, Version 8.5
Resource constraints
- Classification
- Unclassified
Resource constraints
- Other constraints
- This dataset is hosted by the Institute for Marine and Antarctic Studies (IMAS), University of Tasmania, on behalf of CSIRO and NESP Marine and Coastal Hub Projects 2.3.
Resource constraints
- Linkage
-
http://i.creativecommons.org/l/by/4.0/88x31.png
License Graphic
- Title
- Creative Commons Attribution 4.0 International License
- Website
-
http://creativecommons.org/licenses/by/4.0/
License Text
- Other constraints
- Cite data as: Langlois, T., Monk, J., Spencer, C., Flukes, E., Gibbons, B., & Hayes, K. (2025). Testing the effects of scale on benthic habitat modelling in the South-west Corner Marine Park [Data set]. Institute for Marine and Antarctic Studies. https://doi.org/10.25959/2RKJ-H521
Associated resource
- Association Type
- Dependency
- Initiative Type
- Project
- Title
- NESP MaC Project 2.3 - Improving knowledge transfer to support Australian Marine Park decision making and management effectiveness evaluation, 2022-2023 (CSIRO, IMAS)
Identifier
- Language
- English
- Character encoding
- UTF8
Distribution Information
- Distribution format
-
- GeoTIFF
- OnLine resource
- DATA ACCESS - Full data package (.zip of above)
- OnLine resource
-
View & explore South-west Corner broadscale (250m) model outputs in Seamap Australia
Interact with quantile thresholds by selecting an Ecosystem Component from the layer tab options.
- OnLine resource
-
SWC_finescale_EcosystemComponents5class_mean
MAP - fine-scale ecosystem component model
- OnLine resource
-
SWC_broadscale_EcosystemComponents5class_mean
MAP - broad-scale ecosystem component model
Resource lineage
- Statement
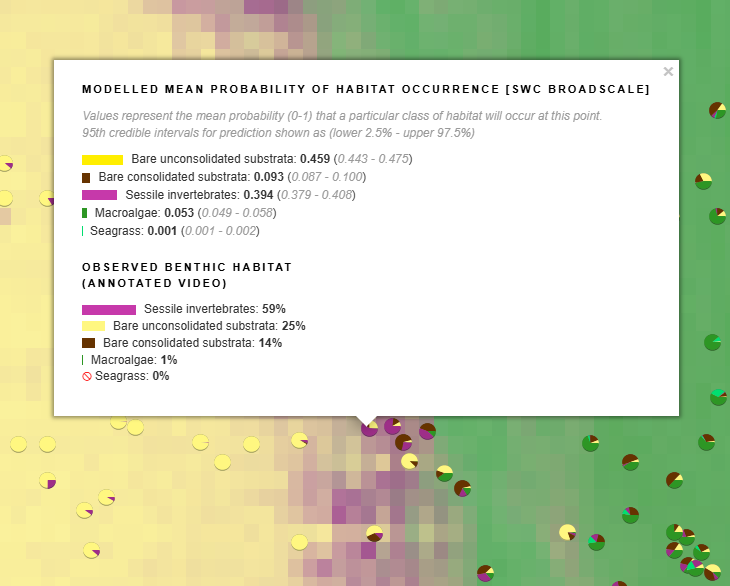
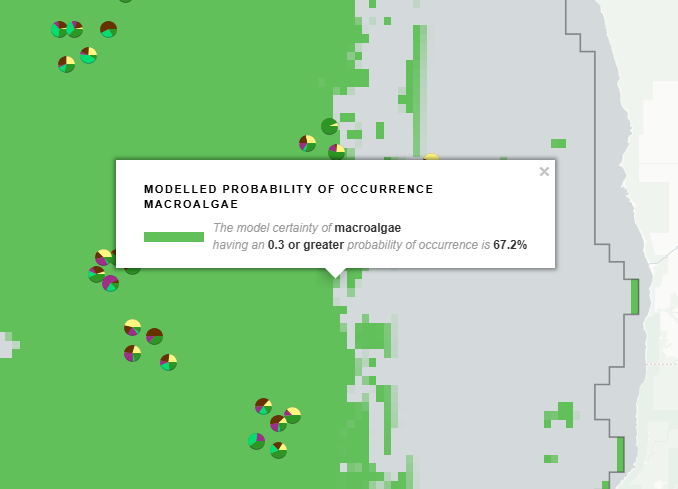
- This modelling approach used a Bayesian implementation of a multinomial generalised linear model. Ground-truthing benthic annotations for mobile species (e.g. echinodermata) were discarded. All remaining annotations were collapsed into the five broad ecosystem components. See NESP Marine and Coastal Project 2.1 final report for a full description of the sampling design, annotation technique, and modelling approach. A key objective of this work was to compare the habitat modelled using input data at high resolution (where available), with that generated from low resolution bathymetric model data, which is readily available and has full coverage of Australian waters (see Beaman, R. (2024). AusBathyTopo (Australia) 250m 2024 - A national-scale depth model. https://dx.doi.org/10.26186/150050). A secondary objective was to evaluate two approaches for presenting model outputs to better support marine management decisions. Both modeling scales provide predicted mean probability of occurrence for each ecosystem component, while the broad-scale model also incorporates model uncertainty, allowing users to define a minimum acceptable occurrence threshold based on their specific needs. ---FINE-SCALE (5 m) MODEL--- https://data.imas.utas.edu.au/attachments/seamap_predicted_habitat/southwest_corner/finescale This approach models the mean probability of occurrence for each of the five ecosystem components (seagrass, sessile invertebrates, macroalgae, bare consolidated, bare unconsolidated) at 5 metre resolution. The data is packaged in two formats: (1) five individual raster files, each representing the mean probability of occurrence for a different ecosystem component. (2) a single 5-band raster where each band corresponds to the mean probability of occurrence for a different ecosystem component: Band 1 = bare consolidated, band 2 = macroalgae, Band 3 = seagrass, Band 4 = bare unconsolidated, Band 5 = sessile invertebrates See ReadMe file for a full description of the data package. ---BROAD-SCALE (250 m) MODEL--- https://data.imas.utas.edu.au/attachments/seamap_predicted_habitat/southwest_corner/broadscale This approach models the same five ecosystem components at 250 metre resolution and provides outputs in two complementary formats: (1) Continuous Probability Estimates Presents set of three rasters for each ecosystem component, representing: - Lower 95th credible interval (0.025 quantile): the lower bound of the predicted probability range. - Mean probability of occurrence: the central estimate based on the posterior distribution. - Upper 95th credible interval (0.975 quantile): the upper bound of the predicted probability range. (2) Thresholded Probability Estimates Presents a set of rasters capturing model certainty at 10 probability thresholds (0.000001 - 0.9) for each ecosystem component. Each raster represents a specific probability threshold (quantile) and indicates the model's certainty that a given habitat class occurs at or above that threshold. This provides a structured way to assess model confidence across different probability levels. This dual representation allows for both a continuous probability assessment and a threshold-based evaluation of model confidence across different probability levels. See ReadMe file for a full description of the data package.
- Hierarchy level
- Dataset
Metadata
- Metadata identifier
- urn:uuid/e1ca78ee-8b4f-42d3-b60a-13bf44faf95b
- Language
- English
- Character encoding
- UTF8
Point of contact
Type of resource
- Resource scope
- Dataset
- Metadata linkage
-
https://metadata.imas.utas.edu.au/geonetwork/srv/eng/catalog.search#/metadata/e1ca78ee-8b4f-42d3-b60a-13bf44faf95b
Point of truth URL of this metadata record
- Date info (Creation)
- 2024-05-13T11:44:25
- Date info (Revision)
- 2026-06-27T10:45:36
Metadata standard
- Title
- ISO 19115-3:2018
Overviews
Spatial extent

Provided by