 IMAS Metadata Catalogue
KELP FOREST
Type of resources
Topics
Keywords
Contact for the resource
Provided by
Years
-
Kelps are in global decline due to climate change, including ocean warming. To identify vulnerable species, we need to identify their tolerances to increasing temperatures and whether tolerances are altered by co-occurring drivers such as inorganic nutrient levels. This is particularly important for those with restricted distributions, which may already be experiencing thermal stress. To identify thermal tolerance of the range restricted kelp Lessonia corrugata, we conducted a laboratory experiment on juvenile sporophytes to measure performance (growth, photosynthesis) across its thermal range (4 – 22 °C). We found the upper thermal limit for growth and photosynthesis to be ~ 22 – 23 °C, with an optimum of ~ 16 °C. To determine if elevated inorganic nitrogen availability could enhance thermal tolerance, we compared performance of juveniles under low (4.5 µmol/day) and high (90 µmol/day) nitrate conditions at and above the thermal optimum (16 – 23.5 °C). Nitrate enrichment did not enhance thermal performance at temperatures above the optimum but did lead to elevated growth rates at the thermal optimum 16 °C. Our findings indicate L. corrugata is likely to be extremely susceptible to moderate ocean warming and marine heatwaves. Peak sea surface temperatures during summer in eastern and northeastern Tasmania can reach up to 20 – 21 °C and climate projections suggest that L. corrugata’s thermal limit will be regularly exceeded by 2050 as south-eastern Australia is a global ocean-warming hotspot. By identifying the upper thermal limit of L. corrugata we have taken a critical step in predicting the future of the species in a warming climate.
-
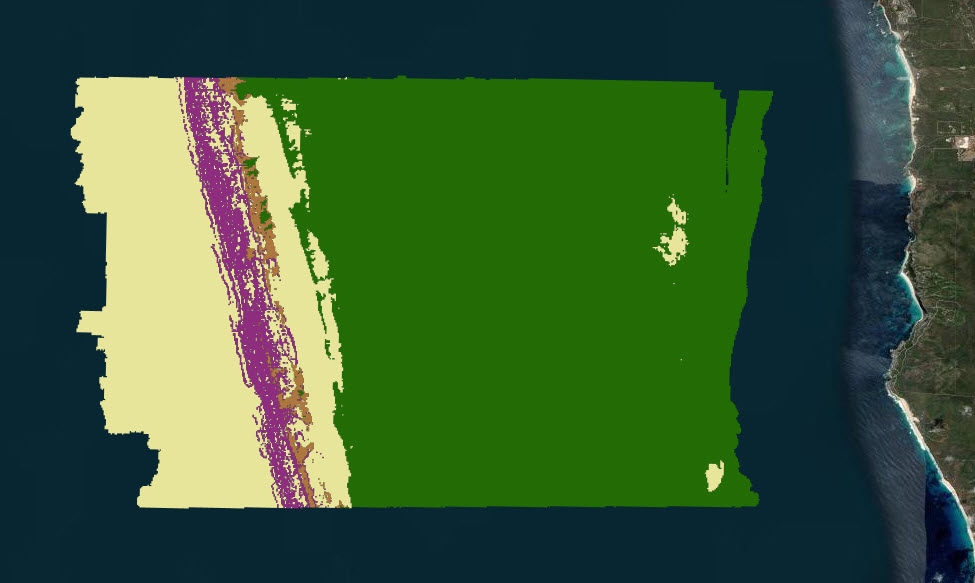
Predictions of dominant habitats were completed as part of a report funded by the NESP Marine & Coastal Hub. This report focussed on an IUCN II zone in the South-west Corner Marine Park off the 'Capes region' near Margaret River. This modelling contains data from stereo Baited Remote Underwater Video and panoramic drop camera, and was completed using the FSS-GAM package in R. Predictions are at two different scales and resolutions, one using the broad 250 metre resolution Geoscience Australia 2009 bathymetry grid (http://dx.doi.org/10.4225/25/53D99B6581B9A) and the other using a 5 metre resolution Geoscience Australia multibeam survey (https://dx.doi.org/10.26186/145281).
-
Fish annotations of stereo Baited Remote Underwater Video and panoramic drop camera imagery, were completed as part of a report funded by the NESP Marine & Coastal Hub. This report focussed on an IUCN II zone in the South-west Corner Marine Park off the 'Capes region' near Margaret River. These data were analysed in EventMeasure using standard operating procedures for the annotation of remote stereo imagery.
-
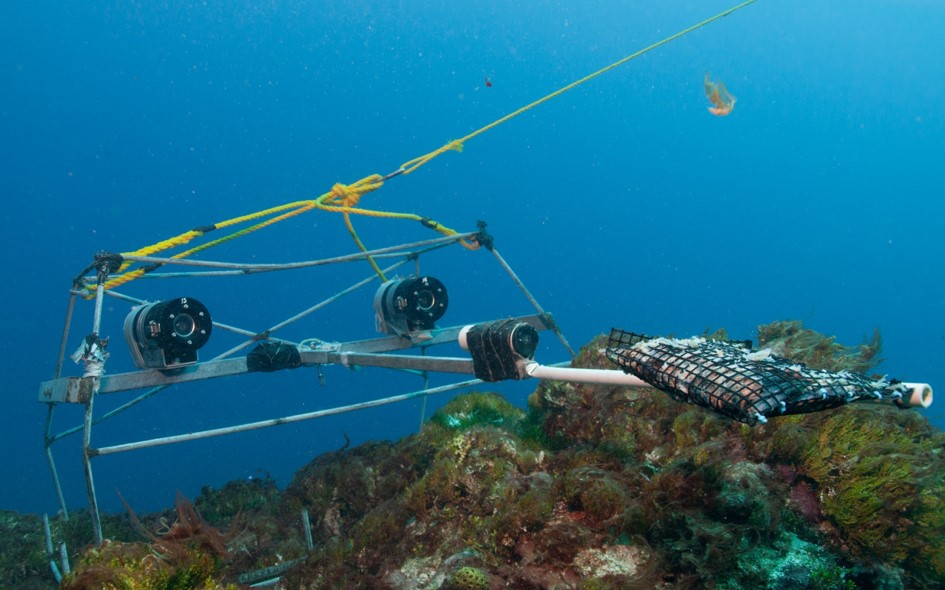
Benthic habitat annotations of stereo Baited Remote Underwater Video (Stereo-BRUV) and panoramic drop camera imagery, were completed as part of a report funded by the NESP Marine & Coastal Hub. This report focussed on an IUCN II zone in the South-west Corner Marine Park off the 'Capes region' near Margaret River. These data were analysed in TransectMeasure using a modified version of the CATAMI scheme.
-
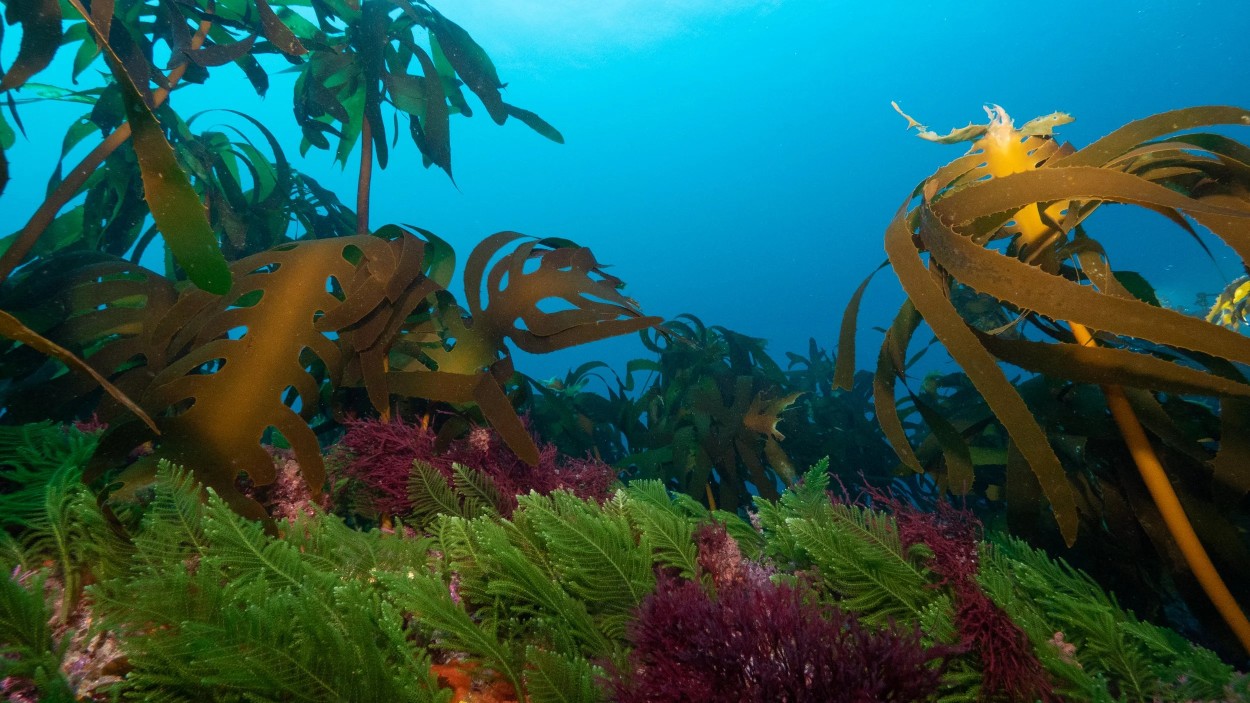
Ecosystems provide numerous services and benefits to society. While historically overlooked, these services are increasingly recognized and are now being mapped and accounted for. There are several approaches to mapping and evaluating these ecosystem services. In this report, we use two increasingly common approaches, Ocean Accounting and Welfare Economics, to evaluate ecosystem services for the Great Southern Reef. The Great Southern Reef is a network of rocky reefs dominated by temperate algal forests known as kelp. It spans over 8,000 Km of coastline and supports two thirds of the Australian population. Despite its presumed importance, there has been little work quantifying the extent and value of the ecosystem services provided by the Great Southern Reef. Through a systematic review we assessed the current state of knowledge of the ecosystem services provided by the Great Southern Reef. Using the Common International Classification of Ecosystem Services (CICES) framework, we created an overview of the ecosystem services (provisioning, regulating, and cultural) provided by the Great Southern Reef in New South Wales, Victoria, Tasmania, South Australia, and Western Australia. We then created metrics to quantify how these services benefit coastal societies in these five states. Highlight summaries include over 17 million Australians who live within 50 Km of the reef, 26 wild seaweed harvest companies, 115 tourism SCUBA operators, 1436 mapped dive sites, 18 million tourist visits each year, 16 temperate marine biology university programs, 43 books and films, key medical products, 23 tons of harvested seaweed, 1116 grams of carbon per m2 used for growth each year, 2,361 peer-reviewed scientific publications from 1976 to 2022, 186 marine protected areas, 2.16 million recreational fishers, and over 28 commercial fisheries with 20,000 tons of biomass taken each year. We then conducted economic evaluations using these biophysical values and the available information. Using a variety of approaches, we found that the total economic value of the Great Southern Reef was $11.56 billion each year. Individually the values were as follows, commercial fishing (producer surplus - $33.2 million), carbon sequestration (avoided damages - $37.8 million), nutrient cycling (avoided damages - $6,484 million), recreational fishing (consumer surplus - $1,668 million), diving and snorkelling (consumer surplus - $403 million), other recreational activities (consumer surplus $1,836 million), and the existence value (consumer surplus - $1,096 million).
-
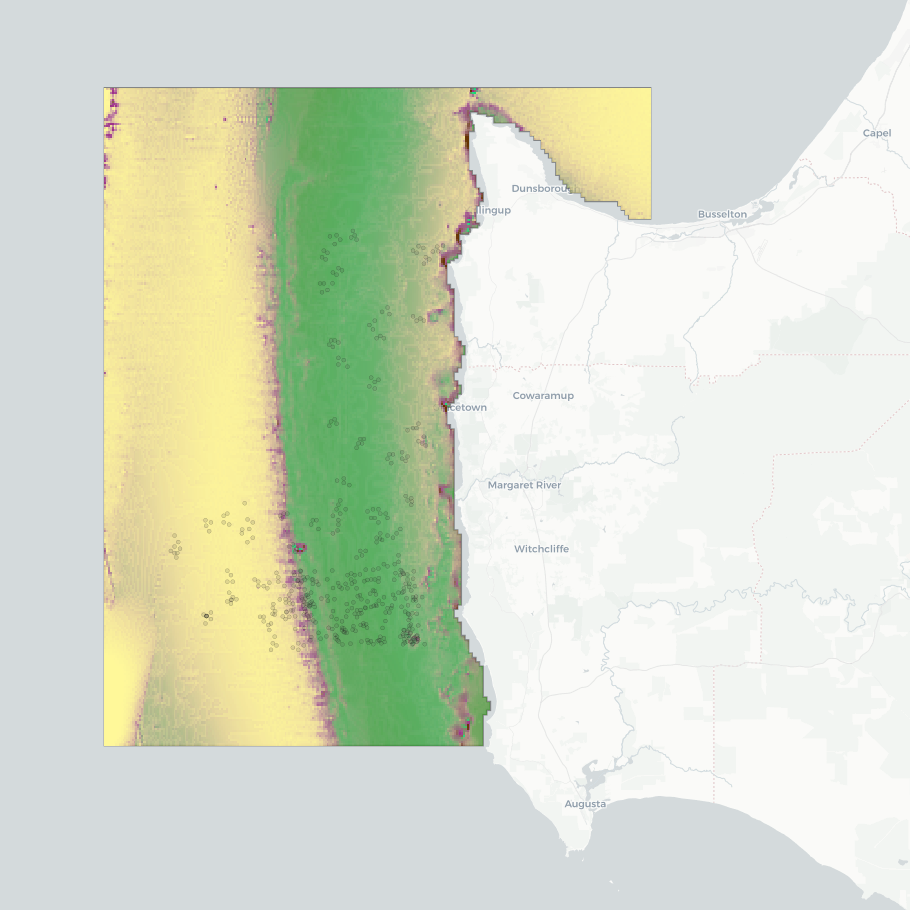
This dataset presents the results of a seafloor habitat modeling exercise for the 'Capes region' of the South-west Corner Marine Park, southern WA. The model classifies five broad habitat types (hereafter 'ecosystem components'): seagrass, macroalgae, sessile invertebrates, bare consolidated substrata, and bare unconsolidated substrata. Modeling was conducted at two spatial scales to assess the effectiveness of using broad-scale (~250 m) spatial covariates derived from bathymetry in mapping habitat classes and to compare the modelling outcomes with those obtained using finer-resolution input data. The fine-scale mapping focused on an IUCN II zone near Margaret River, using a seamless 5 m resolution multibeam bathymetry composite. The broad-scale mapping covered multiple IUCN zones, including the southwestern Geographe Australian Marine Park (AMP), the northwestern tip of the South-west Corner AMP, and the Ngari Capes WA State Marine Park. This component used the 250 m resolution 2023 AusBathyTopo grid from Geoscience Australia. Habitat maps were constructed using (1) the bathymetry data sources described above; (2) ground-truthing observations from stereo-BRUV and BOSS camera systems; and (3) Physical covariates, all smoothed to 5 m or 250 m resolution, for the fine- and broad-scale mapping, respectively. Source datasets are available from: • Geoscience Australia's eCat: https://dx.doi.org/10.26186/145281 (5 m multibeam bathymetry) and https://doi.org/10.26186/148758 (250 m DEM bathymetry) • Squidle+: http://squidle.org/geodata/explore (benthic imagery annotations - see also outputs from NESP MaC Project 2.4: https://doi.org/10.25959/6G5A-3G03) • AODN Portal: https://portal.aodn.org.au/search (IMOS oceanographic datasets). This analysis uses the modelling methodology developed in NESP Project 2.1, which extended the ecosystem component modelling to include all temperate Australian shelf waters at a resolution of 250 m (https://doi.org/10.25959/BVJ7-D984). Analysing the scale effects effects of spatial covarariate inputs was undertaken by NESP Project 2.3, along with exploration of visualisation options regarding prediction certainty in consultation with Parks Australia (management end-users). Further details on sampling design for ground-truthing observations and the modelling techniques are available in the NESP MaC Project 2.1 Final Report: https://www.nespmarinecoastal.edu.au/publication/improving-seabed-habitat-predictions-for-southern-australia. A description on this specific South-west Corner case study and the spatial scale analysis is described in the NESP MaC Project 2.3 Final Report: https://www.nespmarinecoastal.edu.au/publication/improving-knowledge-transfer-to-support-australian-marine-park-decision-making-and-management-effectiveness-evaluation. A selection of mapping (WMS) services are listed in the 'Downloads & Links' section of this record. See the 'Lineage' section for a full description of the data packages available for download, and for more visualisation options.
-
The National Reef Monitoring Network brings together shallow reef surveys conducted around Australia into a centralised database. The IMOS National Reef Monitoring Network sub-Facility collates, cleans, stores and makes this data rapidly available from contributors including: Reef Life Survey, Parks Australia, Department of Biodiversity, Conservation and Attractions (Western Australia), Department of Environment, Water and Natural Resources (South Australia), Department of Primary Industries (New South Wales), Tasmanian Parks and Wildlife Service and Parks Victoria. The data provided by the National Reef Monitoring Network contributes to establishing and supporting national marine baselines, and assisting with the management of Commonwealth and State marine reserves. Reef Life Survey (RLS) and the Australian Temperate Reef Network (ATRC) aims to improve biodiversity conservation and the sustainable management of marine resources by coordinating surveys of rocky and coral reefs using scientific methods, with the ultimate goal to improve coastal stewardship. Our activities depend on the skills of marine scientists, experienced and motivated recreational SCUBA divers, partnerships with management agencies and university researchers, and active input from the ATRC partners and RLS Advisory Committee. RLS and ATRC data are freely available to the public for non-profit purposes, so not only managers, but also groups such as local dive clubs or schools may use these data to look at changes over time in their own local reefs. By making data freely available and through public outputs, RLS and ATRC aims to raise broader community awareness of the status of Australia’s marine biodiversity and associated conservation issues.
-
This dataset comes from the Floating Forests project (https://floatingforests.org). Floating Forests is an online citizen science project attempting to map the cover of surface-canopy forming kelps, primarily the giant kelp Macrocystis pyrifera, using Landsat data. To acquire the data, citizen scientists were given tiles of images taken from the Landsat series of satellites (https://landsat.usgs.gov/) scenes that had been manipulated to make kelp more visible. Landsat has a roughly two week repeat time for the entire globe and a 30m resolution, although given variability in weather quarterly aggregation is recommended. Each image was scene at minimum four times. If no kelp was noted, then it was retired and scored as a zero. If kelp was noted in the first four classifications, then an individual image was shown to fifteen people total. The polygons of kelp beds presented here represent consensus classifications from the platform and are tagged with minimum number of users who classified pixels in the polygons as kelp. For example, at the five user threshold, each area represents pixels where at least five users - not necessarily the same five users - said there was kelp present. This consensus classification has been shown to match very closely to expert classifications. For more information and links to outputs, see https://blog.floatingforests.org in addition to the main project site. Or go to the main project site, and start a conversation in the "talk" section of the site.
-
Observational data for the Kelp Ecosystem Ecology Network. These data come from transects of rocky reefs taken around the world using the KEEN observational data protocol (see http://kelpecosystems.org for full description of methods and handbook). See “How” for methods. Briefly, the observational data consists of the following components, all included here: site information, fish observations, quadrat sampling, band transect sampling, percent cover from uniform point counts, and kelp morphometrics. Data Files Data files included and what they contain are as follows: keen_sites.csv - Physical and locational data for all KEEN sites and transect. keen_cover.csv - Percent cover of sessile algae and invertebrates. keen_fish.csv - Counts of fish by size class along a transect. keen_quads.csv - Counts of common algae, sessile invertebrates, and demersal fish that can be individuated. keen_swath.csv - Counts of rarer algae, sessile invertebrates, and demersal fish that can be individuated. Data Use To use the observational data here for published work we ask that 1) You contact the network coordinator, jarrett.byrnes@umb.edu, and notify them of your intention so that we can coordinate among any ongoing projects using the same data, 2) if the data has not been used in a publication in the literature before, we request that you reach out to the PIs responsible for the data you will be using and engage in a conversation about co-authorship, 3) if it has been used previously, merely cite the datasets associated with each PI that you use. The references are listed below. For access to the entire data cleaning and processing pipeline, see https://github.com/kelpecosystems/observational_data. For access to scans of the original data sheets, contact jarrett.byrnes@umb.edu. ------------------------------------------------------ For general methods: Byrnes, Jarrett E.K., Haupt, Alison J., Reed, Daniel C., Wernberg, Thomas., Pérez-Matus, Alejandro., Shears, Nick T., Konar, Brenda, Gagnon, Pat, and Vergés, Adriana. 2014. Kelp Ecosystem Ecology Network Monitoring Handbook. Kelp Ecosystem Ecology Network. For specific data sets, use the following, but also include date the data is accessed from this record in order to track the data version used. Byrnes, Jarrett E.K., Haupt, Alison J., Lyman, Ted. 2014. Kelp forest communities at Appledore Island, the Boston Harbor Islands, and Salem Sound. Kelp Ecosystem Ecology Network. Dijkstra, Jennifer A., Mello, Kristen. 2015. Kelp forest communities at York, Maine. Kelp Ecosystem Ecology Network. Grabwoski, Jonathan and MacMahan, Marissa. 2015. Kelp forest communities in Nahant, Massachusetts, and Pemaquid, Maine. Kelp Ecosystem Ecology Network. Humphries Austin T., Paight C, Ben-Horin Tal, Green Lindsay, Thornber, Carol. 2016. Kelp forest communities in Narragansett Bay, Rhode Island. Kelp Ecosystem Ecology Network. Rasher, Douglass and Price, Nicole. 2017. Kelp forest communities of central and downeast Maine. Kelp Ecosystem Ecology Network. Peréz-Matus, Alejandro and Shaughnessy, Brianna. 2017. Kelp forest communities of central and northern Chile. Kelp Ecosystem Ecology Network.
-
This record provides an overview of the NESP Marine and Coastal Hub bridging study - "Future-proofing restoration & thermal physiology of kelp". For specific data outputs from this project, please see child records associated with this metadata. -------------------- Kelp forests create complex habitats that support a diverse and productive community of marine life. They underpin coastal food-webs, fisheries, and a suite of other ecosystem services including nutrient and blue carbon cycling. Across much of the world, kelp forests are in decline and under threat from stressors including urbanisation, overgrazing, ocean warming, and marine heatwaves driven by climate change. Australia’s giant kelp (Macrocystis pyrifera) forests are listed as a Threatened Ecological Community under the Environment Protection and Biodiversity Conservation Act 1999. Habitat restoration is a potential tool for the conservation and management of giant kelp ecosystems. Given the direct impacts of climate change and ocean warming, there is growing recognition of the need for habitat restoration to be ‘future proofed’. For restoration to be effective, the cause of habitat decline must be understood and overcome. This is problematic when climate change is driving habitat loss since it cannot be reversed or ameliorated prior to restoration. A previous NESP project led by this team (NESP Marine Biodiversity Hub Project E7) identified warm-tolerant strains of giant kelp from remnant patches in eastern Tasmania, where the species has experienced precipitous declines due to ocean-warming. These strains have high potential to assist with ‘future-proofing’ kelp forest restoration, however it is still unclear what the physiological mechanisms are that provide their improved thermal tolerance. It is also unknown whether cross-breeding the identified warm-tolerant giant kelp strains will affect and potentially improve their thermal tolerance capacity. This project explored the physiology of kelp thermal performance, specifically the mechanisms potentially responsible for the warm water tolerance identified in particular giant kelp strains. It confirmed the improved ability of the warm-tolerant strains to develop at stressful warm temperatures relative to normal giant kelp, and demonstrated for the first time that their improved thermal performance may extend to the development and fertilisation. The outcomes progress toward the identification of populations of Australian kelp that may be resilient to (or especially threatened by) ocean warming and climate change. Outputs • Ecophysiological measurements from laboratory experiments of warm-tolerant vs average giant kelp genotypes [dataset] • Final Project Report including a short summary of recommendations for policy makers of key findings [written]