 IMAS Metadata Catalogue
CSIRO Oceans and Atmosphere
Type of resources
Topics
Keywords
Contact for the resource
Provided by
Years
-
This record provides an overview of the NESP Marine and Coastal Hub small-scale study - "Conservation of spotted handfish". For specific data outputs from this project, please see child records associated with this metadata. -------------------- Spotted Handfish (Brachionichthys hirsutus) were once common across the bays and estuaries of South-eastern Tasmania. By 1996, however, populations had declined and the species was listed as Critically Endangered under Australia’s Environment Protection and Biodiversity Conservation Act 1999. The species is relatively short-lived, (5–10 years) and matures at more than two years’ old. This leaves a short window for reproduction, which relies on egg masses laid on seafloor structures such as stalked ascidians. If spawning fails, population declines may occur rapidly. With no planktonic life stage to aid dispersal, and low adult dispersal, outside recruitment to re-establish collapsed populations is unlikely. Analysis of 23 years of Spotted Handfish survey data (1997–2019) supported by previous NESP Marine Biodiversity Hub work (Project A10) helped develop a time-series of survey data, increasing biological understanding and contributing to effective management actions. This project recommenced surveys of multiple local populations, after a two-year gap, to ensure that the potential impacts of development of the Derwent estuary and surrounds handfish populations or their habitats can be detected. Included in the population surveying was identification of suitable locations to plant Artificial Spawning Habitats (ASH) where natural spawning structures have declined. This will continue to support the species' captive breeding program with industry and foster engagement with the indigenous and broader community through participation, talks, outreach, publications, and the National Handfish Recovery Team (NHRT). Outputs • A consolidated database of all available data on spotted handfish imagery, length frequency, and GPS regions to 2022 [time-series database] • Final Project Report, including a short summary of recommendations for policy makers of key findings [written]
-
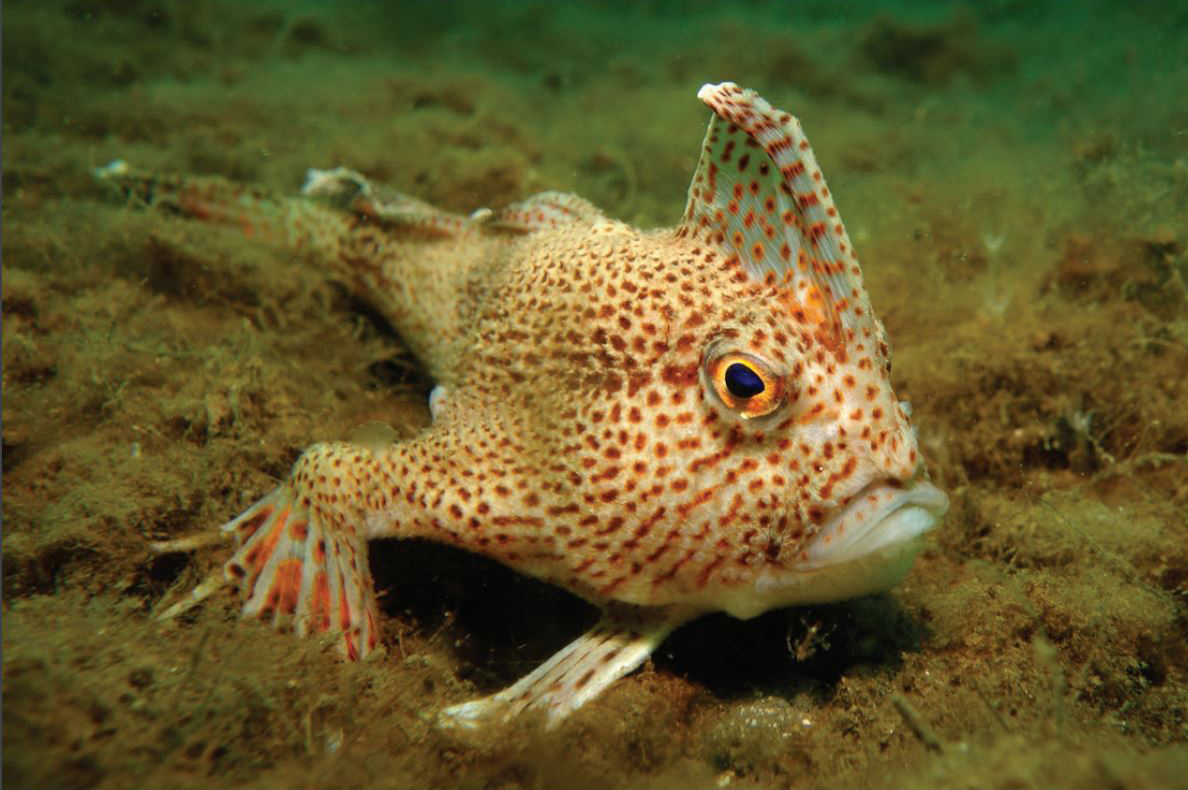
Dive surveys were conducted in 2014 and the same sites resurveyed annually until 2022 (excluding 2021), to establish a baseline and monitor the status of the critically endangered spotted handfish (Brachionichthys hirsutus) population. This dataset is a summary of all surveys season 2014 to 2022 (excluding 2021) in which the 11 sites across the Derwent Estuary and D'Entrecasteaux Channel were assessed. The data describes the search effort (transect length, swathed area) and counts of handfish observed on each transect, including size measurements (total length) and depth records for each sighted fish.
-
This record provides an overview of the scope and research output of the NESP Marine Biodiversity Hub project "Estimation of population abundance and mixing of southern right whales in the Australian and New Zealand regions". For specific data outputs from this project, please see child records associated with this metadata. -------------------- A comprehensive understanding of the population abundance and degree of spatial connectivity of southern right whales (Eubalaena australis) in Australian waters is currently lacking. This limits assessments of the species recovery and understanding of the nature and degree of difference between the south-eastern and south-western Australian populations. This project brought together existing photo-identification datasets, including records held in the Australian Right Whale Photo-Identification Catalogue (ARWPIC), to support a national assessment of southern right whale population dynamics and connectivity. It estimated total Australian population abundance, investigated links between whales using breeding areas along the eastern, southern and western coasts of Australia, and assessed future data collection needs for ongoing monitoring. The project supported evaluation of progress against the Conservation Management Plan for southern right whales and contributed to more coordinated conservation planning for the species at regional and national scales.
-
At the inception of our project, no study had examined particle fluxes in the Subantarctic Zone (SAZ) of the Southern Ocean, despite the fact that the SAZ represents a large portion of the total area of the Southern Ocean, serve as a strong sink for atmospheric (~1G t C yr-1 [Metzl et al., 1999]), and is central to hypotheses linking particle fluxes and climate change [Francois et al., 1997; Kumar et al., 1995; Sigman et al., 1999]. The SAZ serves as an interface between the cold nutrient-rich waters to its south and the nutrient-depleted subtropical gyres to its north. SAZ upper layers are marked by a thick layer of relatively homogenous Subantarctic Mode Water (SAMW), which overlies Antarctic Intermediate Water (AAIW). Both water masses are subducted northward beneath the subtropical gyres. Thus particles leaving the surface in these regions contribute to carbon redistribution via both the fraction that reaches the deep sea by settling and the fraction that is remineralized within SAMW or AAIW and subsequently subducted. The SAZ exhibits surface water carbon dioxide partial pressures well below atmospheric equilibrium, but PFZ waters are closer to atmospheric equilibrium in this sector [Metal et al., 1999; Poppet al., 1999]. The relative physical and biological contributions to these carbon dioxide partial pressure variations are unclear, but it is important to determine them because physical and biological carbon dioxide transfers are expected to show different responses to climate change [ Matear et al., 1999; Sarmiento and LeQuere, 1996]. For these reasons we focused on the SAZ and, for comparative purposes, on the PFZ to its south. We measured particle fluxes using moored sinking particle traps at three sites in the SAZ, in the PFZ, and beneath the Subantarctic Front (SAF), which separates them. This record describes particle flux data collected between 2000 and 2001. The NetCDF data contains the following variables. Please note not all variables are supplied in all files, specifically there are not uncertainty estimates and no quality control flags for this data. -----DATA DICTIONARY----- Name, description, units, standard name TIME, time, YYYY-MM-DD, time of sample midpoint TIME_START, time sample open, YYYY-MM-DD, time sample open NOMINAL_DEPTH, depth, m, nominal depth LATITUDE, latitude, degrees_north, latitude of anchor LONGITUDE, longitude, degrees_east, longitude of anchor pressure_actual, actual, dbar, actual pressure sample, sample number, 1, sample number sample_quality_control, quality flag for sample number, unitless, quality flag for sample number mass_flux, <1mm, mg m-2 d-1, particulate total mass flux mass_flux_uncertainty, uncertainty for particulate total mass flux, mg m-2 d-1,), uncertainty for particulate total mass flux mass_flux_quality_control, quality flag for particulate total mass flux, unitless, quality flag for particulate total mass flux SAL_BRINE, supernatant, 1, sample supernatant practical salinity SAL_BRINE_uncertainty, uncertainty for sample supernatant practical salinity, 1, uncertainty for sample supernatant practical salinity SAL_BRINE_quality_control, quality flag for sample supernatant practical salinity, unitless, quality flag for sample supernatant practical salinity pH_BRINE, supernatant, 1, sample supernatant pH NBS scale pH_BRINE_uncertainty, uncertainty for sample supernatant pH NBS scale, 1, uncertainty for sample supernatant pH NBS scale pH_BRINE_quality_control, quality flag for sample supernatant pH NBS scale, unitless, quality flag for sample supernatant pH NBS scale PC_mass_flux, <1mm, mg m-2 d-1, particulate total carbon mass flux PC_mass_flux_uncertainty, uncertainty for particulate total carbon mass flux, mg m-2 d-1, uncertainty for particulate total carbon mass flux PC_mass_flux_quality_control, quality flag for particulate total carbon mass flux, unitless, quality flag for particulate total carbon mass flux PN_mass_flux, <1mm, mg m-2 d-1, particulate total nitrogen mass flux PN_mass_flux_uncertainty, uncertainty for particulate total nitrogen mass flux, mg m-2 d-1, uncertainty for particulate total nitrogen mass flux PN_mass_flux_quality_control, quality flag for particulate total nitrogen mass flux, unitless, quality flag for particulate total nitrogen mass flux POC_mass_flux, <1mm, mg m-2 d-1, particulate organic carbon mass flux POC_mass_flux_uncertainty, uncertainty for particulate organic carbon mass flux, mg m-2 d-1, uncertainty for particulate organic carbon mass flux POC_mass_flux_quality_control, quality flag for particulate organic carbon mass flux, unitless, quality flag for particulate organic carbon mass flux PIC_mass_flux, <1mm, mg m-2 d-1, particulate inorganic carbon mass flux PIC_mass_flux_uncertainty, uncertainty for particulate inorganic carbon mass flux, mg m-2 d-1, uncertainty for particulate inorganic carbon mass flux PIC_mass_flux_quality_control, quality flag for particulate inorganic carbon mass flux, unitless, quality flag for particulate inorganic carbon mass flux BSi_mass_flux, <1mm, mg m-2 d-1, particulate biogenic silicon mass flux BSi_mass_flux_uncertainty, uncertainty for particulate biogenic silicon mass flux, mg m-2 d-1, uncertainty for particulate biogenic silicon mass flux BSi_mass_flux_quality_control, quality flag for particulate biogenic silicon mass flux, unitless, quality flag for particulate biogenic silicon mass flux TIME_END, time sample closed, YYYY-MM-DD, time sample closed Reference, citable reference DOI, DOI
-
This database contains molecular data of elasmobranchs in northern Australian rivers, estuaries and coasts undertaken under the National Environmental Research Program (NERP) Marine Biodiversity Hub Project 2.4 'Supporting Management of Listed and Rare Species'. and the National Environmental Science Program (NESP) Marine Biodiversity Hub Project A1 'Northern Australian Hotspots for the Recovery of Threatened Euryhaline Elasmobranchs'. Surveys using gillnets and rod-and-line were undertaken in the Top End region of the Northern Territory and the Kimberley region of Western Australia. Tissue samples were collected from all elasmobranchs for molecular analyses (population genetics and close-kin mark-recapture).
-
This dataset comprises summaries of sight and resight data compiled for the NESP MBH project A13 and derived from data housed in the Australian Right Whale Photo Identification Catalogue (ARWPIC) and associated effort summaries. These summaries have been compiled as part of an analysis of mark recapture information in establishing trends in the population and spatial connectivity of individuals across southern Australia. The summaries are based on original sightings data collected across 1990-2018 by ARWPIC partners. The ARWPIC is housed at the Australian Antarctic Division and managed by the Australian Marine Mammal Centre.
-
The MOU74 Box, off the northwest Australian coastline, is an area of approximately 50,000 sq. km within the Australian Fishing Zone. It contains five large, shallow reef systems (less than 15 m deep) ranging in size from 227 sq. km (Ashmore Reef) to 4.5 sq. km (Browse Island). They total approximately 560 sq. km in area. Immediately north of the MOU74 Box within the Australian Fishing Zone (Little Area A) is another shallow reef, Hibernia Reef. In addition to the shallow reefs, there is approximately 925 sq. km of shoal areas (15 to 50 m deep) within the MOU74 Box and 301 sq. km of shoal areas in Little Area A. The reefs and shoals support populations of sedentary reef resources including several species of holothurians (beche-de-mer, sea cucumbers) and trochus, as well as reef-associated fin-fish and sharks. These resources have been fished for many years by Indonesian fishers. Ashmore Reef was declared a Marine Nature Reserve in 1983, banning the removal of fauna and flora to a depth of 50 m. The remaining reefs in the area are under continued, and probably increasing, fishing pressure. The marine resources of the MOU74 Box are managed by the Australian Government. Under the terms of a memorandum of understanding (MOU) between the Australian and Indonesian governments, continued traditional fishing by Indonesian fishing vessels is allowed, principally for sedentary resources such as beche-de-mer (trepang) and trochus, but also fin-fish and reef shark. Apart from limited catch data collected by surveillance and regulatory authorities, little is known about the catch of the Indonesian fishers and the effects of fishing on the target species. There are concerns that the current level of fishing may be unsustainable. In September and October 1998, CSIRO Division of Marine Resources surveyed the shallow reefs (0-15 m deep) and shoal areas (15-50 m deep) of the MOU74 Box area and Little Area A to the north. Its purpose was to assess the status of the reef resources in the area, and the environment that supports them. Fieldwork for the survey was completed on 10 October 1998. Overall, the sedentary marine living resources on the shallow reefs were heavily depleted with the high-value species over-exploited and the lower value species probably either fully or over-exploited. Despite the low density, there appears to be a sustained fishing effort by Indonesian fishers in the area. A drastic reduction in effort would be required to allow for a recovery of the higher value species, and to protect other species from severe depletion. The exception is Ashmore Reef, where there were significant populations of most target species. However, there is most likely some illegal fishing occurring on Ashmore Reef and there is clear evidence of exploitation of at least the high-value resources. The nature of these fisheries and the depleted state of the other reefs in the MOU74 Box suggests that the remaining resources on Ashmore Reef could be quickly depleted if the protection currently given to the reef is not maintained and possibly enhanced. For many reasons, including the potential for recruitment of larvae to depleted reefs, it is important that these populations are protected. Year round protection of the resources on Ashmore Reef should be considered. This record describes the following survey data for the Timor MOU74 Box: • Classified satellite habitat map for Scott and Seringapatam Reefs. • Classified satellite habitat map for Ashmore, Hibernia and Cartier Reefs.
-

This record provides an overview of the scope of the NESP Marine Biodiversity Hub project "Identification of near-shore habitats of juvenile white sharks in south-western Australia". No data outputs were generated by this project. -------------------- In 2018, CSIRO provided the first estimate of adult abundance for the southern-western Australian white shark (Carcharodon carcharias) population. At the time, total population abundance could not be estimated because of limited information on the juvenile life-history stage. This project investigated whether juvenile white sharks from this population use near-shore habitats near the head of the Great Australian Bight. It investigated credible anecdotal evidence of juvenile white shark presence in the region and was designed as a pilot study to inform future survey and project development. The project reviewed existing sources of evidence and undertook unmanned aerial vehicle (AUV) surveys in near-shore habitats within and around the Nuyts Archipelago Marine Park. Thirty-five UAV flights were completed during 2018 and 2019, covering approximately 7.5 km². No white sharks were identified in the UAV footage, although several other marine species and shorebirds were observed. Additional evidence from scientific surveys indicated that the Head of Bight and surrounding marine park areas may be important habitat for white sharks across multiple life stages. The project included engagement with the Yalata Land Management Indigenous Ranger team, who were consulted during project planning and survey activities. The findings informed future project development by assessing the value of further on-water activities, expanded UAV surveys and targeted monitoring in the Great Australian Bight region.
-

This record provides an overview of the scope and research output of the NESP Marine Biodiversity Hub project "Conservation of handfish and their habitat". For specific data outputs from this project, please see child records associated with this metadata. -------------------- Spotted Handfish (Brachionichthys hirsutus) and Red Handfish (Thymichthys politus) are Critically Endangered species with small, fragmented populations in southern Tasmania. Spotted Handfish persist only in isolated sub-populations in the Derwent and D’Entrecasteaux estuaries, where recovery is constrained by limited dispersal, specific spawning habitat requirements, degraded habitat, introduced predators, pollution, mooring impacts and coastal development. This project established and extended a monitoring and conservation program for Spotted and Red Handfish in accordance with the Handfish Recovery Plan. For Spotted Handfish, it built on baseline surveys of all known southern Tasmanian sub-populations and applied an innovative georeferenced photographic survey method using towed floats, GPS tracking and individual spot-pattern identification. These data supported density estimates, capture-mark-recapture analysis, assessment of movement between sub-populations, and tracking of conservation actions. From 2019–2020, the project expanded to include Red Handfish and implemented direct conservation actions informed by monitoring and research. Activities included replacement of degraded plastic artificial spawning habitat with redesigned ceramic units, assessment of taut eco-friendly moorings in critical Spotted Handfish habitat, genetic and capture-mark-recapture studies for both species, population viability analysis, and evaluation of management actions. The project also supported captive breeding with industry partners, re-established the Handfish Recovery Team, and contributed to community engagement through talks, outreach and publications. Outputs provided data and evidence to guide artificial spawning habitat placement, brood-stock collection decisions, predator management, mooring replacement, and future recovery planning for both species.
-

This record provides an overview of the NESP Marine and Coastal Hub bridging study - "Support for Parks Australia’s Monitoring, Evaluation, Reporting and Improvement System for Australian Marine Parks". For specific data outputs from this project, please see child records associated with this metadata. -------------------- The system of marine parks that spans Australia’s Commonwealth waters is among the largest in the world. These parks play a major role in conserving marine life, supporting commercial and recreational activities, and protecting cultural values significant to Aboriginal and Torres Strait Islander peoples. Parks Australia has developed management plans for five regional Australian Marine Park (AMP) networks (North, North-west, South-west, South-east and Temperate East) and the Coral Sea Marine Park (CSMP). Under each management plan, a science plan sets priorities for monitoring and research to evaluate management effectiveness and identify opportunities for improvement. This prioritisation is vital given the limited knowledge across many AMPs, the technical challenges and high costs of science in remote areas, and the finite resources available for park management. Building on foundational work from the NESP Marine Biodiversity Hub (projects SS2 and D7), this project delivered the scientific and technical advice needed to establish monitoring priorities for natural values and pressures across all AMP networks and the CSMP—completing a full national priority list for monitoring. It applied a nationally consistent four-step prioritisation framework that considered ecological importance, vulnerability to pressures, baseline data availability, and logistical feasibility. The project also updated the National Ecosystem model and Pressures & Activities datasets, conducted expert vulnerability assessments, and produced a Relative Cumulative Impact index. The combined research delivers a nationally accepted "common language" to describe natural values and pressures and a science-based method to derive monitoring priorities, aligned with the Monitoring, Evaluation, Reporting and Improvement (MERI) system—an adaptive management framework that is globally unique and a significant step towards adaptive, integrated, place-based management. Key outputs include a national database of environmental and human-use data for each management region and a refined list of monitoring priorities for each AMP Network and the CSMP. The findings highlight major knowledge gaps—particularly in the distribution of mesophotic and rariphotic reefs, intertidal ecosystems, and recreational fishing impacts—and provide guidance for improving baseline data and pressure assessments. The prioritisation framework and data products developed through this project can be re-generated over time alongside improvements in the evidence base and our understanding of how ecosystems respond to multi-sectoral activities to support continual improvement in iterative, evidence-based park management and environmental outcomes. Outputs • Digital map layers per AMP network of: (1) Ecosystems; (2) Pressures & Activities; and (3) Cumulative Benthic & Pelagic Impacts • Final Technical Report containing maps of Key Natural Values, and of spatial Monitoring Priorities, including a short summary of recommendations for policy makers of key findings [written]