 IMAS Metadata Catalogue
EARTH SCIENCE | BIOLOGICAL CLASSIFICATION | ANIMALS/VERTEBRATES | FISH
Type of resources
Topics
Keywords
Contact for the resource
Provided by
Years
-
Policy and decision makers often seek guidance as to the benefits of conservation and repair of coastal seascapes, to justify and underpin any potential investments. Much is already known about the broad habitat and nursery values of seascapes among the science community, but there is also a need for estimation of clear and unambiguous market-based benefits that may arise from investment in repair. Recognising that this economic knowledge is imperfect for Australian seascapes, three case studies spanning tropical, subtropical and temperate environments explored the benefits in question. The case studies focus on saltmarsh habitats in particular, which have received very little investment in repair despite subtropical and temperate coastal saltmarsh listed as vulnerable ecological community under Australian Federal legislation. A subset of economically important species and conservative judgments were used to characterise the minimum potential economic benefit. For each of the case studies the conclusion was that while the biological information will remain imperfect, the business case for investment in the repair and conservation of coastal seascapes is compelling. We outline priorities for further research to make the business case more tangible to policy makers, stakeholders and the general public.
-
The data describes number of vessels, engine power, gross tonnage and fishing effort by year (1950-2017), targeted functional group, and fishing gear. Fishing effort estimates were derived from country-level fishing fleet capacity data publicly available, following the method described in Rousseau et al (2019; https://doi.org/10.1073/pnas.1820344116) and methods improvement reported in Rousseau et al. (in prep). The data coverage is global, but estimates are given at the Exclusive Economic Zone-, Large Marine Ecosystem-, and Food Agriculture Organisation-level. The data was collected for a wide range of uses, including to inform global and regional marine ecosystem models and to understand the long-term evolution of fishing and its socio-ecological implications in the global ocean.
-
This submission creates a static snapshot of data from the Autonomous Underwater Vehicle (AUV) and stereo-BRUV annotation data from the National Environmental Science Program (NESP) Elizabeth and Middleton Reef survey. More details on the survey can be found at https://www.nespmarine.edu.au/document/elizabeth-and-middleton-reefs-lord-howe-marine-park-post-survey-report.
-
Ecosystem data was collected as part of an integrated study of the continental shelf over a 2 and a half year period between November 2015 and January 2018. Data were collected bi-monthly through the spring to autumn (November, January, March, May). Stations were situated perpendicular to shelf bathymetry, ranging in depth from ~50 m to 100 m near the edge of the shelf and were located between 5 km and 15 km from land; encompassing from south Storm Bay, past the southern tip of Bruny Island and into the Southern Ocean (south-east Tasmania, Australia). Data collected focused on each trophic level, characterizing the zooplankton community, fish schools and marine predators. The overarching aim of the study was to investigate the effects of long term warming, and a marine heatwave event on zooplankton dynamics in terms of community response variables and the flow-on effects of changing lower-trophic level dynamics for top predators.
-
This dataset describes the relative abundance of an assemblage of commercially exploited demersal fishes in northwestern Australia, mapped over a 30 arc-minute (0.5 degree) spatial grid. The data cover the period 1997-2006 and are derived from an analysis of commercial landings available through the Sea Around Us Project (http://www.seaaroundus.org/). Further methodological details can be found in the following peer-reviewed publication, which applies the same analysis to a suite of mobile pelagic species: Bouchet PJ, Meeuwig JJ, Huang Z, Letessier TB, Nichol SL, Caley MJ, Watson RA. 2016. Continental-scale hotspots of pelagic fish abundance inferred from commercial catch records. Global Ecology and Biogeography. Below is a full list of species/genera/families considered, with their respective contributions to the total catch (%): -------------------------------------------------- Mustelus -- 26.1948% Platycephalidae -- 23.3191% Seriolella -- 10.8968% Sillaginidae -- 9.4242% Genypterus blacodes -- 5.8347% Pristiophorus -- 4.4934% Tetraodontidae -- 4.3235% Nemadactylus -- 4.2784% Squatinidae -- 3.6071% Mugilidae -- 3.181% Sparidae -- 2.7037% Chelidonichthys kumu -- 0.7146% Rajiformes -- 0.4497% Pterygotrigla polyommata -- 0.3911% Scorpaenidae -- 0.1292% Callorhinchus milii -- 0.0367% Rhombosolea -- 0.0046% Pleuronectiformes -- 0.0034% Leiognathidae -- 0.003% Lates calcarifer -- 0.0029% Ariidae -- 0.0025% Sciaenidae -- 0.0017% Nemipteridae -- 0.0014% Nemipterus -- 0.0014% Upeneus -- 0.001% Data will be attached to this record once analyses are completed, est. December 2016.
-
The Flinders CMR survey was a pilot study undertaken in August 2012 as part of the National Marine Biodiversity Hub's National monitoring, evaluation and reporting theme. The aim of this theme is to develop a bluepint for the sustained monitoring of the South-east Commonwealth Marine Reserve Network. The particular aims of the survey were twofold; 1) to contribute to an inventory of demersal and epibenthic conservation values in the reserve and 2) to test methodologies and deployment strategies in order to inform future survey design efforts. Several gear types were deployed; including multibeam sonar, shallow-water (less than 150m) Baited Remote Underwater Video (BRUVs), deep- water BRUVs, towed video and digital stereo stills. This resource contains the shallow-water BRUV footage captured on the FLinders CMR shelf (less than 150 m). Stereo BRUV's were deployed using a probabalistic and spatially-balanced survey design called Generalized Random Tessellation Stratified (GRTS). Habitats were identified in a previous multibeam survey and consisted of 'mixed reef' (containing patchy reef) and sand. Mixed reef habitat was targeted in this survey (9 GRTS mixed reef sites versus 3 sand sites). A total of 60 stereo BRUVs were deployed. Data contained here represents footage collected using these drops and the associated scored data (abundance (MaxN) and lengths).
-
Baited remote underwater stereo-video (stereo-BRUV) were used to sample the fish assemblages of the Hunter Marine Park and adjacent Port Stephens - Great Lakes Marine Park at equivalent depths. Stereo-BRUV were deployed in both autumn and spring from spring 2016 to autumn 2018 and at depth of 32-105m. The videos were analyse to all fish species to the lowest taxonmic level and estimate relative abundance (MaxN) and lengths of all species. This information was used to form a baseline of the benthic fish assemblages of the Hunter Marine Park. This study was done as part of the NESP Marine Biodiversity Hub D3 project (https://www.nespmarine.edu.au/project/project-d3-implementing-monitoring-amps-and-status-marine-biodiversity-assets-continental).
-
The data is the quantitative abundance of fish derived from underwater visual census methods involving transect counts at rocky reef sites around Tasmania. This data forms part of a larger dataset that also surveyed megafaunal invertebrate abundance and algal cover for the area. The aggregated dataset allows examination of changes in Tasmanian shallow reef floral and faunal communities over a decadal scale - initial surveys were conducted in 1992-1995, and again at the same sites in 2006-2007. There are plans for ongoing surveys. An additional component was added in the latter study - a boat ramp study looking at the proximity of boat ramps and their effects of fishing. We analysed underwater visual census data on fishes and macroinvertebrates (abalone and rock lobsters) at 133 shallow rocky reef sites around Tasmania that ranged from 0.6 - 131 km from the nearest boat ramp. These sites were not all the same as those used for the comparison of 1994 and 2006 reef communities. The subset of 133 sites examined in this component consisted of only those sites that were characterized by the two major algal (kelp) types (laminarian or fucoid dominated). Sites with atypical algal assemblages were omitted from the 196 sites surveyed in 2006. This study aimed to examine reef community data for changes at the community level, changes in species richness and introduced species populations, and changes that may have resulted from ocean warming and fishing. The methods are described in detail in Edgar and Barrett (1997). Primarily the data are derived from transects at 5 m depth and/or 10 m depth at each site surveyed. The underwater visual census (UVC) methodology used to survey rocky reef communities was designed to maximise detection of (i) changes in population numbers and size-structure (ii) cascading ecosystem effects associated with disturbances such as fishing, (iii) long term change and variability in reef assemblages.
-
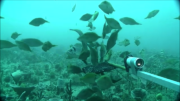
Interaction uncertainties between tidal energy devices and marine animals have the potential to disrupt the tidal energy industry as it advances. Best-practices for environmental impact assessments (EIAs) must be explored that are able to provide conclusive recommendations for mitigating environmental impact concerns of tidal energy developments. As the tidal energy industry is moving closer to commercial-scale array installations, the development of standardised EIAs would allow for potential impact concerns for the marine environment to be identified and minimised early in the site-development process. In an effort to help formulate a standardised EIA framework that addresses knowledge gaps in fish-current interactions at tidal energy candidate sites, this study investigated changes in fish aggregations in response to tidal currents at a tidal energy candidate site in Australia prior to turbine installation. Here, we present the dataset collected for this study that includes tidal current information from Acoustic Doppler Current Profiler (ADCP) measurements, volume backscattering strength from a four-frequency biological echosounder (Acoustic Zooplankton and Fish Profiler – AZFP) as an indicator for fish biomass, and fish aggregation metrics calculated from volume backscatter in post-processing. ADCP and AZFP were installed on a bottom-mounted mooring and engaged in a concurrent sampling plan for ~2.5 months from December 2018 to February 2019. The mooring was deployed in the Banks Strait, a tidal energy candidate site located in the northeast of Tasmania, Australia, at a location favourable for tidal turbine installations considering current speed, depth, substrate, sediment type and proximity to shore. The ADCP dataset includes current velocity and direction measurements at a 1 m vertical and 1-sec time intervals. The raw AZFP dataset includes volume backscattering strength collected at 4-sec time intervals with a vertical resolution of 0.072 m in raw, and 0.1 m in pre-processed form. Fish aggregation metrics were derived in post-processing and are presented by the minute along with corresponding environmental conditions for current speed, shear, temperature, diel stage, and tidal stage compiled from both AZFP and ADCP datasets.
-
Opportunistic visual surveys were conducted in transit to, and within, the Oceanic Shoals Commonwealth Marine Reserve (CMR) in the Timor Sea during September and October 2012 onboard the RV Solander. This resource comprises species lists and estimated counts of marine mammals, sea snakes, seabirds, sea turtles and other large wildlife encountered during the voyage. The Oceanic Shoals Commonwealth Marine Reserve survey was undertaken as an activity within the Australian Government's National Environmental Research Program Marine Biodiversity Hub and was the key component of Research Theme 4 - Regional Biodiversity Discovery to Support Marine Bioregional Plans. Hub partners involved in the survey included the Australian Institute of Marine Science, Geoscience Australia, the University of Western Australia, Museum Victoria and the Museum and Art Gallery of the Northern Territory. Data acquired during the survey included: multibeam sonar bathymetry and acoustic backscatter; sub-bottom acoustic profiles; physical samples of seabed sediments, infauna and epibenthic biota; towed underwater video and still camera observations of seabed habitats; baited video observations of demersal and pelagic fish, and; oceanographic measurements of the water column from CTD (conductivity, temperature, depth) casts and from deployment of sea surface drifters. Further information on the survey is available in the post-survey report published as Geoscience Australia Record 2013/38: Nichol, S.L., Howard, F.J.F., Kool, J., Stowar, M., Bouchet, P., Radke, L.,Siwabessy, J., Przeslawski, R., Picard, K., Alvarez de Glasby, B., Colquhoun, J., Letessier, T. & Heyward, A. 2013. Oceanic Shoals Commonwealth Marine Reserve (Timor Sea) Biodiversity Survey: GA0339/SOL5650 - Post Survey Report. Record 2013/38. Geoscience Australia: Canberra. (GEOCAT #76658).