 IMAS Metadata Catalogue
MAMMALS
Type of resources
Topics
Keywords
Contact for the resource
Provided by
Years
-
Redmap is a primarily a website that invites the community to spot, log and map marine species that are uncommon in their region, or along particular parts of their coast. The information collected is mapped and displayed on the site, demonstrating, in time, how species distributions may be changing. Sightings are divided into two categories – those with a photo that can be ‘verified’ by a marine biologist, and sightings without photos that we call community sightings (anecdotal). All the information collected, with and without photos, is mapped and will be used in the following years to map out a ‘story’ of changes occurring in our marine environment. The main data collected includes the species sighted (normally selected from a list comprising preselected species of interest), the location, date/time and activity being undertaken. Other optional information gathered include biological data such as sex, size and weight and environmental data such as water depth and temperature and habitat. This record is associated with live data (and will subsequently change over time) and spatial elements have reduced accuracy. It is also subject to a three year embargo (ie. does not contain data less than three years old). If you wish to discuss obtaining a citable, static dataset, that is current and/or contains accurate spatial elements, please see Point of Contact.
-
Redmap is a primarily a website that invites the community to spot, log and map marine species that are uncommon in their region, or along particular parts of their coast. The information collected is mapped and displayed on the site, demonstrating, in time, how species distributions may be changing. Sightings are divided into two categories – those with a photo that can be ‘verified’ by a marine biologist, and sightings without photos that we call community sightings (anecdotal). All the information collected, with and without photos, is mapped and will be used in the following years to map out a ‘story’ of changes occurring in our marine environment. The main data collected includes the species sighted (normally selected from a list comprising preselected species of interest), the location, date/time and activity being undertaken. Other optional information gathered include biological data such as sex, size and weight and environmental data such as water depth and temperature and habitat. This record is associated with live data (and will subsequently change over time) and spatial elements have reduced accuracy. It is also subject to a three year embargo (ie. does not contain data less than three years old). If you wish to discuss obtaining a citable, static dataset, that is current and/or contains accurate spatial elements, please see Point of Contact.
-
Redmap is a primarily a website that invites the community to spot, log and map marine species that are uncommon in their region, or along particular parts of their coast. The information collected is mapped and displayed on the site, demonstrating, in time, how species distributions may be changing. Sightings are divided into two categories – those with a photo that can be ‘verified’ by a marine biologist, and sightings without photos that we call community sightings (anecdotal). All the information collected, with and without photos, is mapped and will be used in the following years to map out a ‘story’ of changes occurring in our marine environment. The main data collected includes the species sighted (normally selected from a list comprising preselected species of interest), the location, date/time and activity being undertaken. Other optional information gathered include biological data such as sex, size and weight and environmental data such as water depth and temperature and habitat. This record is associated with live data (and will subsequently change over time) and spatial elements have reduced accuracy. It is also subject to a three year embargo (ie. does not contain data less than three years old). If you wish to discuss obtaining a citable, static dataset, that is current and/or contains accurate spatial elements, please see Point of Contact.
-
Redmap is a primarily a website that invites the community to spot, log and map marine species that are uncommon in their region, or along particular parts of their coast. The information collected is mapped and displayed on the site, demonstrating, in time, how species distributions may be changing. Sightings are divided into two categories – those with a photo that can be ‘verified’ by a marine biologist, and sightings without photos that we call community sightings (anecdotal). All the information collected, with and without photos, is mapped and will be used in the following years to map out a ‘story’ of changes occurring in our marine environment. The main data collected includes the species sighted (normally selected from a list comprising preselected species of interest), the location, date/time and activity being undertaken. Other optional information gathered include biological data such as sex, size and weight and environmental data such as water depth and temperature and habitat. This record is associated with live data (and will subsequently change over time) and spatial elements have reduced accuracy. It is also subject to a three year embargo (ie. does not contain data less than three years old). If you wish to discuss obtaining a citable, static dataset, that is current and/or contains accurate spatial elements, please see Point of Contact.
-
Redmap is a primarily a website that invites the community to spot, log and map marine species that are uncommon in their region, or along particular parts of their coast. The information collected is mapped and displayed on the site, demonstrating, in time, how species distributions may be changing. Sightings are divided into two categories – those with a photo that can be ‘verified’ by a marine biologist, and sightings without photos that we call community sightings (anecdotal). All the information collected, with and without photos, is mapped and will be used in the following years to map out a ‘story’ of changes occurring in our marine environment. The main data collected includes the species sighted (normally selected from a list comprising preselected species of interest), the location, date/time and activity being undertaken. Other optional information gathered include biological data such as sex, size and weight and environmental data such as water depth and temperature and habitat. This record is associated with live data (and will subsequently change over time) and spatial elements have reduced accuracy. It is also subject to a three year embargo (ie. does not contain data less than three years old). If you wish to discuss obtaining a citable, static dataset, that is current and/or contains accurate spatial elements, please email enquiries@redmap.org.au.
-
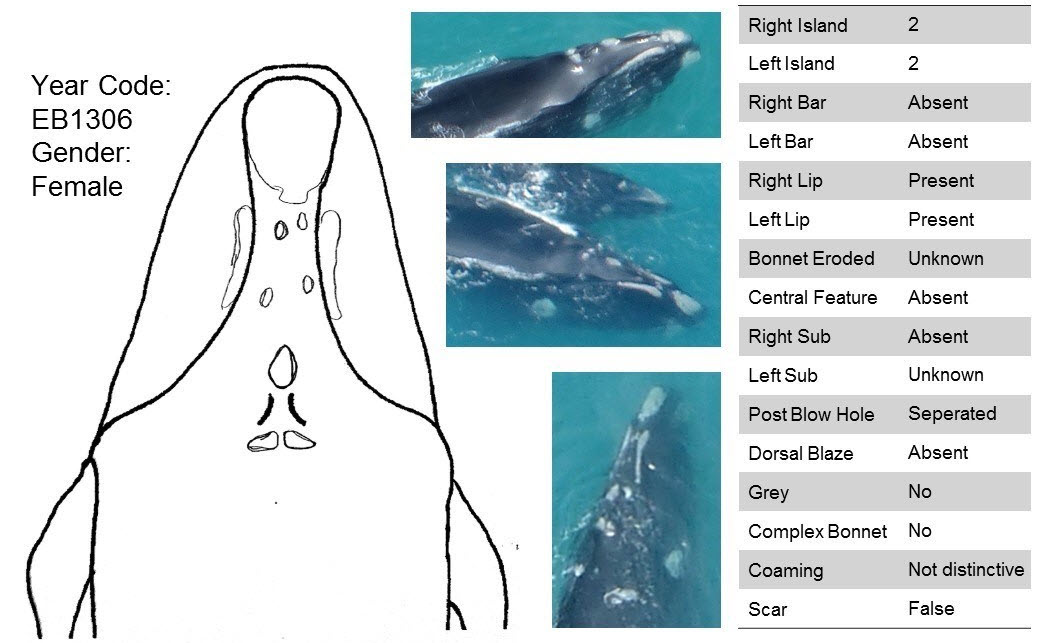
The population of southern right whales in the Southern Hemisphere has been recovering slowly from near extinction due to its decimation from whaling before its ban in 1935 and cessation in the mid-1970’s. As the species recovers, there is increasing evidence of expansion of aggregation areas, including breeding grounds off the coast of Australia. Consequently, there is a need to update known southern right whale established aggregation areas recognised nationally as Biologically Important Areas (BIAs), as well as the national Southern Right Whale Conservation Management and Recovery Plan, which are both used in decision-making using new evidence. This project collated over 2,000 images collected entirely opportunistically by researchers, volunteer citizen scientists, and whale watch operators, and completed matching of individually identifiable whales in photos (i.e., Photo-ID) between 1991 to 2021 in the southwest corner of Australia to evaluate abundance, residency, site fidelity and connectivity in this historically data limited region. The results are reported in the NESP report for Project 1.22 ("A photo-identification study of southern right whales to update aggregation area classification in the southwest of Australia"). A goal of this project was also to upload unique individual southern right whale Photo-IDs into the Australasian Right Whale Photo-Identification Catalogue (ARWPIC; AMMC 2021). The process for these Photo-IDs are briefly described here.
-
Redmap is a primarily a website that invites the community to spot, log and map marine species that are uncommon in their region, or along particular parts of their coast. The information collected is mapped and displayed on the site, demonstrating, in time, how species distributions may be changing. Sightings are divided into two categories – those with a photo that can be ‘verified’ by a marine biologist, and sightings without photos that we call community sightings (anecdotal). All the information collected, with and without photos, is mapped and will be used in the following years to map out a ‘story’ of changes occurring in our marine environment. The main data collected includes the species sighted (normally selected from a list comprising preselected species of interest), the location, date/time and activity being undertaken. Other optional information gathered include biological data such as sex, size and weight and environmental data such as water depth and temperature and habitat. This record is associated with live data (and will subsequently change over time) and spatial elements have reduced accuracy. It is also subject to a three year embargo (ie. does not contain data less than three years old). If you wish to discuss obtaining a citable, static dataset, that is current and/or contains accurate spatial elements, please see Point of Contact.
-
Redmap is a primarily a website that invites the community to spot, log and map marine species that are uncommon in their region, or along particular parts of their coast. The information collected is mapped and displayed on the site, demonstrating, in time, how species distributions may be changing. Sightings are divided into two categories – those with a photo that can be ‘verified’ by a marine biologist, and sightings without photos that we call community sightings (anecdotal). All the information collected, with and without photos, is mapped and will be used in the following years to map out a ‘story’ of changes occurring in our marine environment. The main data collected includes the species sighted (normally selected from a list comprising preselected species of interest), the location, date/time and activity being undertaken. Other optional information gathered include biological data such as sex, size and weight and environmental data such as water depth and temperature and habitat. This record is associated with live data (and will subsequently change over time). Note that the accuracy of spatial elements has been reduced for distribution purposes. This data set is also subject to a three year embargo (ie. does not contain data less than three years old). If you wish to discuss obtaining a citable, static dataset, that is current and/or contains precise spatial elements, please see Point of Contact.
-
This metadata record supports the following paper (abstract below): Green, D.B., Bestley, S., McMahon, C.R., Lea, M.A., Harcourt, R.G., Guinet, C. and Hindell, M.A., 2025. Elephant seal dive behaviour responds consistently to changes in foraging success regardless of sex or ocean habitat. PeerJ, 13, p.e20378. https://doi.org/10.7717/peerj.20378 This metadata record links to a Figshare repository that includes the analysis dataset along with workflows (and a readme) for creating it, running the analyses within the paper, and reproducing the figures. A complete record of the seal tracking data supporting this study can be found on the IMOS AODN data portal, along with additional data on depth, temperature and salinity collecetd by the seal tags. This can be accessed through the following URL: https://portal.aodn.org.au/search, and selecting the side tabs: "Biological platforms" --> "land-sea mammals" Paper Abstract Understanding how air-breathing diving animals moderate their dive behaviour when foraging successfully is foundational in the study of their foraging ecology. Yet, this fundamental relationship remains unresolved with previous research pointing to inconsistent relationships, differing nominally according to sex, habitat type and scale. Empirically testing the relationships between dive effort responses and foraging success is further hampered because of challenges obtaining concurrent measures of behavioural responses and foraging success at sea. We compiled a multi-decadal dive dataset from 609 southern elephant seals, including their dive responses (transit rate, and relative dive and surface recovery duration) and buoyancy – changes in which provide an indirect measure of body condition change and foraging success. Using this dataset, we tested how seal dive behaviour alters when foraging remotely at sea. We found that as foraging success increased, seals increased transit (ascent, descent) rates and decreased relative dive durations for a given depth, with no response in surface recovery. Our results were consistent across sexes and foraging habitats, and account for the general effects of buoyancy on dive behaviour. The homogeneity of these findings suggests that there is a general functional response in which elephant seals perform, on average, shorter, steeper dives during periods of successful foraging. Importantly, we can align these results with predictions from the marginal value theorem (MVT), that a forager should remain in a patch only until gains drop below the neighbourhood mean. Our findings have broad-based implications for how ecologists interpret dive responses of wild marine animals, demonstrating the value of seeking independent in situ information on foraging success.
-
This project undertook a review of existing environmental literature and data on threatened and migratory marine species data to inform the sustainable development of Offshore Renewable Energy (ORE) projects (primarily wind) in Australia. A list of priority species and species of secondary importance were identified by the project together with stakeholders from DCCEEW and NOPSEMA. This list comprised of 100 species of birds, cetaceans, bony fish, sharks, pinnipeds and marine turtles. A literature search was undertaken for each species using a systematic approach detailed in the 'Lineage' section of this record. Each publication was assessed for whether the study location was within or near the ORE area and an attribute populated to indicate the ORE area(s) overlapped. Studies with spatial coverages not overlapping the ORE area were still retained if they were located nearby the ORE area, for species with poorly-defined distributions (e.g. short-finned pilot whales), or for migratory coastal birds that may use the ORE area as migration corridors. The potential impacts of ORE infrastructure and operation for each species was noted from a controlled list of potential impacts. The main topic of the study, and the methodologies used in the study, were also recorded, along with the general spatial location(s) of the study and the publication citation. The resultant inventory serves as a comprehensive record of existing publications associated with priority species potentially at risk from ORE developments, along with the nature of the potential impact. The inventory is intended to provide research information and methods for use in the planning, development, operation, and decommissioning phases of the offshore wind sector. The dataset attached to this record provides a spatial index of of all publications identified through this inventory process. Observation data each of the species were additionally compiled from BirdLife Australia, Atlas of Living Australia (ALA), Ocean Biodiversity Information System (OBIS), Victorian Biodiversity Atlas Victorian Biodiversity Atlas (VBA), and GlobalArchive (a repository of stereo-video annotations data). These data are freely available to download from each of the source repositories.