 IMAS Metadata Catalogue
Shipping
Type of resources
Topics
Keywords
Contact for the resource
Provided by
Years
-

This resource is a map of aids to navigation that are mangaed by AMSA. One of AMSA 's key responsibilities is the management of the Commonwealth aids to navigation network. AMSA manages a network of 399 aids to navigation locations around Australia's coastline assisting mariners to make safe and efficient passages. The network includes traditional lighthouses, beacons, buoys, racons, Differential Global Positioning System (DGPS) and Automatic Identification System (AIS) stations, broadcasting tide gauges and the REEFREP ship reporting system. Only lists operational navigational aids that are the responsibility of AMSA other operational features may exist that are the responsibility of State or local authorities.
-
This resource is a Map of Vessel traffic in the Australian EEZ for the periods 2018/19 - 2022/23 and current 2022/23. The data presented here are summaries of the tracks of vessels between the points identified by either AUSREP or AIS, summarised to the number of KM per 0.1 deg grid square. The Craft Tracking System (CTS) and Mariweb are AMSAs vessel traffic databases. They collect vessel traffic data from a variety of sources, including terrestrial and satellite shipborne Automatic Identification System (AIS) data sources. This dataset has been built from AIS data extracted from CTS, and it contains vessel traffic data for the month of November 2024. The dataset covers the extents of Australias Search and Rescue Region. Each point within the dataset represents a vessel position report and is spatially and temporally defined by geographic coordinates and a Universal Time Coordinate (UTC) timestamp respectively. https://www.operations.amsa.gov.au/spatial/DataServices/DigitalData
-
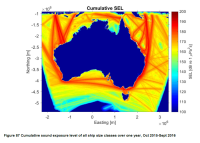
***NOTE THIS RECORD HAS BEEN SUPERSEDED BY NESP PROJECT E2 (details below)*** Cumulative Sound Exposure Levels of shipping traffic in Australian waters was undertaken over a one year period (Sept. 2015 to Oct 2016) within the Australian Exclusive Economic Zone. A proof of concept cumulative ship noise map was developed around Australia using the Perth Canyon source spectra as the source level for different vessel type categories. Sound propagation models were then run cumulatively, integrating the time spent by ships within a grid cell over the one-year period. This record describes the proof of concept map of commercial shipping noise in Australian waters developed under NESP Project C5. Refer to final report (https://www.nespmarine.edu.au/document/quantification-risk-shipping-large-marine-fauna-across-australia-final-report) for full methodology and PDF map. The ship noise modelling demonstrated the potential for using simple and readily accessible transmission models to provide an accurate representation of shipping noise within the marine soundscape. A subsequent high resolution sound exposure map was generated under NESP Project E2. See https://catalogue.aodn.org.au/geonetwork/srv/en/metadata.show?uuid=480847b4-b692-4112-89ff-0dcef75e3b84