 IMAS Metadata Catalogue
Global / Oceans | Global / Oceans | Southern Ocean
Type of resources
Topics
Keywords
Contact for the resource
Provided by
-
This Classification Catalog shows example images for all biotic labels used in developing the Antarctic Seafloor Annotated Imagery Database (AS-AID). This catalog represents a snapshot of the database at the time of publication of the associated data-paper. The labels used are based on the Australian Morphospecies Catalog, which is an extension of the CATAMI classification scheme. All underlying data are publicly available on Squidle+ (https://squidle.org). Up to 16 randomly selected images are presented for each classification, alongside a table with the following information: • Found in campaigns: a list of all campaigns in AS-AID in which this organism has been detected • Total annotations: the total number of annotations for this label • VME-taxa: whether this label is identified as a CCAMLR Vulnerable Marine Ecosystem taxa
-
A compilation of existing literature on the characteristics of Southern Ocean diatom species.
-
δ18Oara profile for shelled pteropod calcification depth estimate based on seawater salinity and temperature measured by Argo floats. The oxygen isotopic composition of pteropod shells (δ18Optero) was compared to the δ18Oara at different depths. The calcification depth is defined as the depth where the values of δ18Optero and δ18Oara were equal within their respective uncertainties. Shelled pteropods are at risk from ocean acidification, with known effects on their shell durability and calcification. Pteropods typically form their aragonitic shells over specific depth ranges known as the ‘calcification depth’, which varies depending on species and habitats. Some Southern Ocean waters are already undersaturated with respect to aragonite and this could negatively affect shelled pteropods. However, the calcification depths of the pteropods have not been determined nor used to infer consequences of changing seawater carbonate chemistry in the Southern Ocean. In this study, we analysed the stable oxygen isotopic composition of Limacina rangii shells, collected by sediment traps in the subantarctic zone, to estimate their calcification depth. Shallow calcification depths (13-126 m) were detected in summer-autumn, while L. rangii calcified their shells deeper in the water column during winter-spring, with an average maximum calcification depth of 525 m. Recent shoaling of the aragonite saturation horizon is likely to negatively affect pteropods that calcify their shells in deep water. Such shoaling is likely to reduce shell formation and threaten population viability.
-

Aerial surveys of southern right whales (Eubalaena australis) were undertaken off the southern Australian coast to monitor the recovery of this endangered species following extreme 19th and 20th Century commercial whaling. The aerial survey was undertaken in the coastal waters from Perth (Western Australia) to Ceduna (South Australia) between the 12th and 17th August 2021, to maintain the annual series of surveys and inform the long-term population trend. The maximum whale counts for each leg of the survey flights between Cape Leeuwin and Ceduna, and consisted of a total 643 southern right whales sighted across the survey area (270 cow-calf pairs and 103 unaccompanied whales). The subsequent population estimate for the Australian ‘south-western’ population is 2,549 whales, which represents the majority of the Australian population given the very low numbers in the ‘south-eastern’ subpopulation. The population long-term trend data is indicating recent years (from 2007) are showing greater inter-annual variation in whale counts. To evaluate the recovery of the southern right whale population, it will be critical to collect long-term data on the annual variability in whale numbers related to the non-annual female breeding cycle and identify possible impacts on this by short-term climate dynamics, longer-term climate change and/or anthropogenic threats.
-
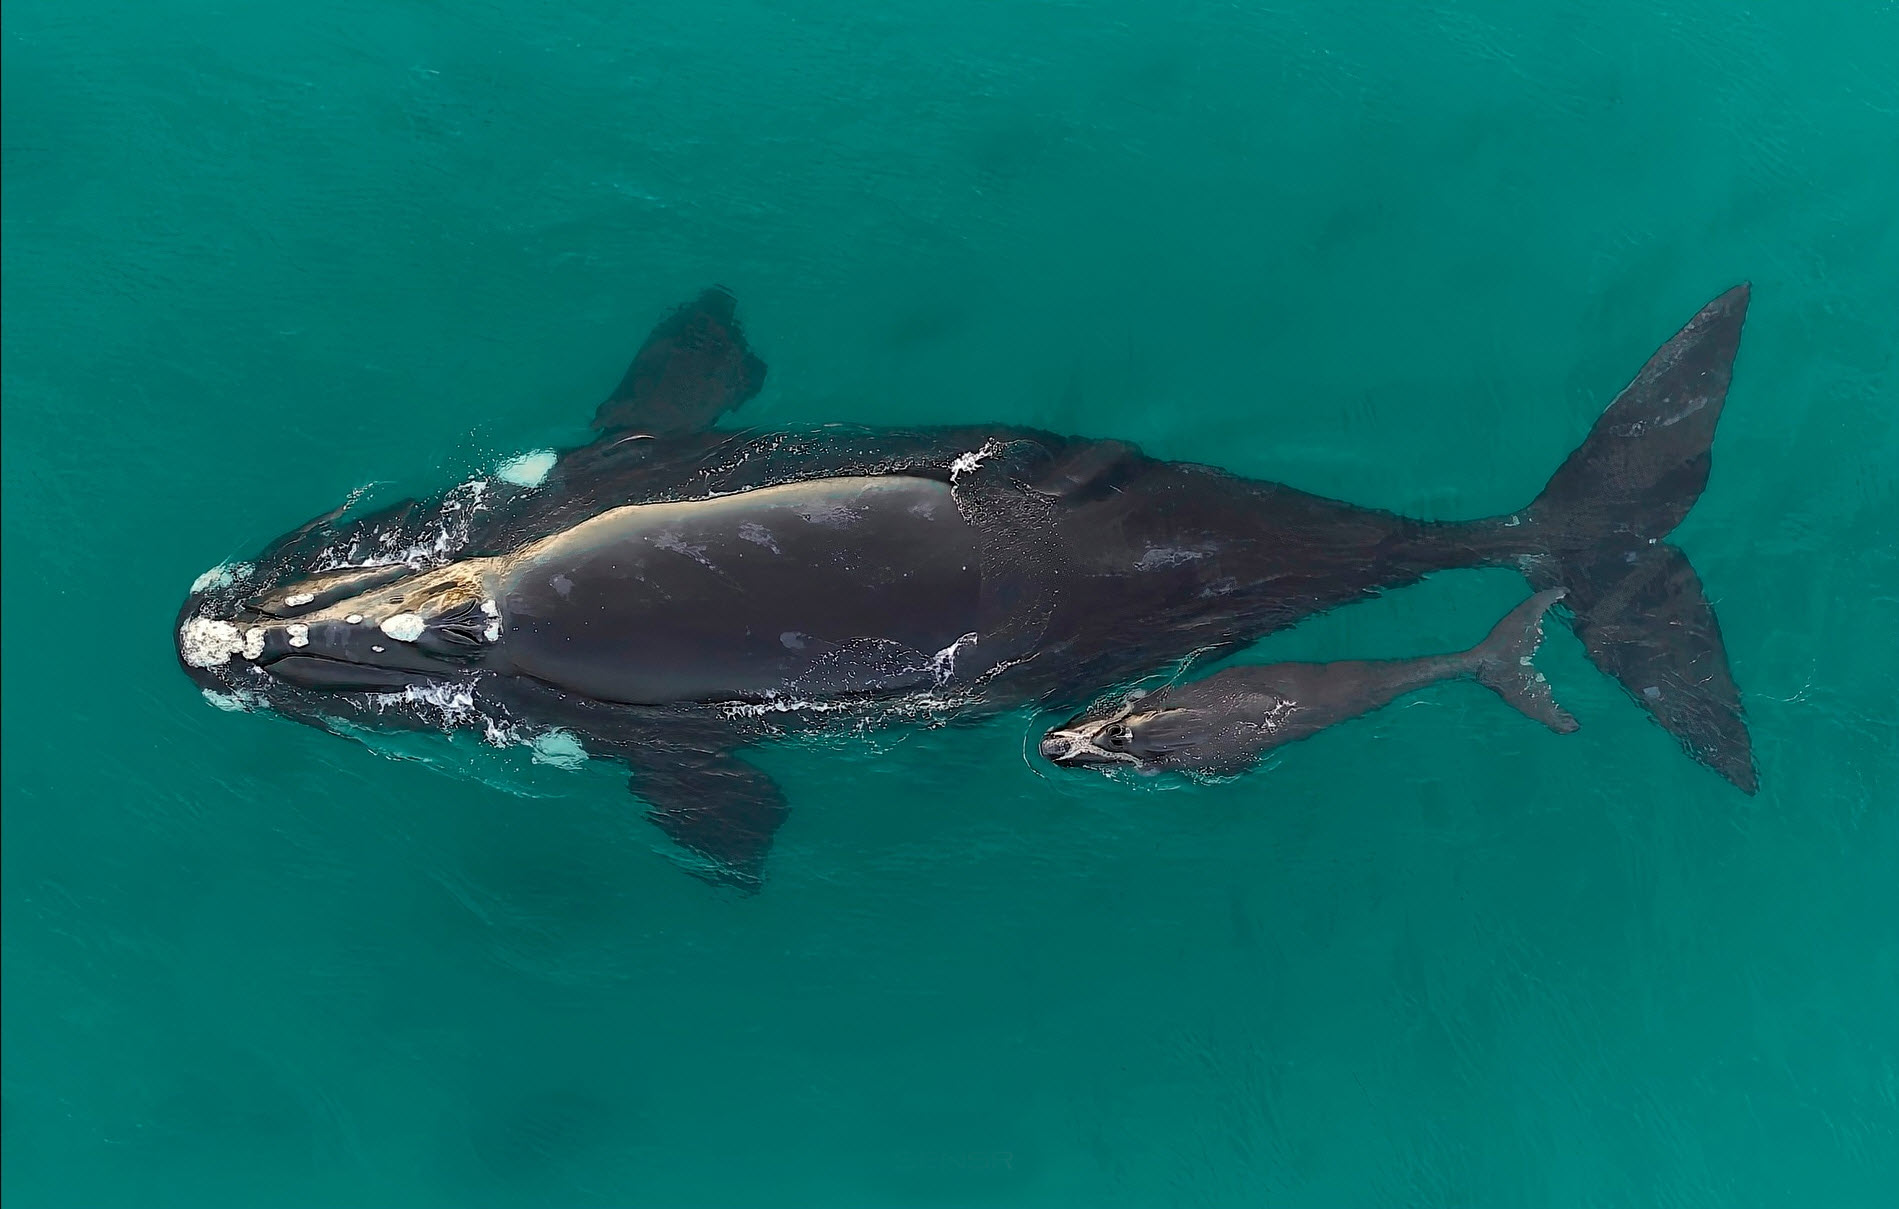
Aerial surveys of southern right whales (Eubalaena australis) were undertaken off the southern Australian coast to monitor the recovery of this endangered species following extreme 19th and 20th Century commercial whaling. The aerial survey was undertaken in the coastal waters from Perth (Western Australia) to Ceduna (South Australia) between the 12th and 19th August 2022, to maintain the annual series of surveys and inform the long-term population trend. The survey resulted in a total 526 whales sighted, consisting of 247 cow-calf pairs, 31 unaccompanied adults and 1 yearling. The ‘western’ population of southern right whales in Australian waters is increasing in size (~5.3% per year based on female/calf pairs and a population estimate of 2675 whales) based on the long-term population trend data from the annual aerial surveys. This represents the majority of the Australian population given the very low numbers in the ‘eastern’ population. The 2022 surveys recorded the lowest number of unaccompanied animals (i.e. males and females without a calf) ever throughout the time-series of the annual aerial surveys since 1993 when survey coverage between Cape Leeuwin and Ceduna first began. Across this time series, there is a particularly notable decline in sightings of unaccompanied animals over the past five years. It is currently unclear what factors account for the decline in these sightings or may influence the variation in numbers of unaccompanied animals on the southern Australian coast. Lower than expected counts in the long-term data may provide evidence of a slowing population growth rate, which can only be assessed by continued annual population surveys to assess population trend data.
-
This dataset contains images from 21 individual Antarctic research campaigns between 1985 and 2019, collated as part of the Antarctic Seafloor Annotated Imagery Database (AS-AID). A total of 632,252 expert annotations are associated with these seafloor images. This dataset is a static snapshot of the AS-AID images at the time of publication of the data descriptor. All images are also accessible from https://data.imas.utas.edu.au/imagery/IMAS_Antarctic/ The dataset contains images and associated tracklog metadata for each research campaign.
-
This dataset is derived from a comparative study evaluating six DNA extraction methods for their efficiency in recovering diatom sedimentary ancient DNA (sedaDNA) from Antarctic marine sediments. Sediment samples were collected from two sites: U1536C (Scotia Sea, West Antarctica) and KC02 (Sabrina Coast, Totten Glacier Region, East Antarctica). Each of the six extraction methods was applied to the same set of samples. Following shotgun metagenomic sequencing, the methods were assessed based on metrics such as diatom DNA recovery, average fragment length, and taxonomic diversity. The purpose of the study was to identify the optimal extraction approach for maximizing the yield and quality of diatom sedaDNA, thereby improving its utility for paleoenvironmental reconstruction.
-
This dataset contains image annotations for 21 Antarctic research campaigns between 1985 and 2019, recorded as part of the Antarctic Seafloor Annotated Imagery Database (AS-AID). This snapshot of the AS-AID annotations comprises of a total of 632,252 expert annotations. Annotations are based on the Collaborative and Automated Tools for Analysis of Marine Imagery (CATAMI) classification scheme and have been reviewed by experts. Three annotation sets exist for each campaign: point grid annotations of 108 points per image, bounding box annotations for mobile fauna, and bounding box annotations for select benthic species which are classified as Vulnerable Marine Ecosystem species. All annotations are also accessible through Squidle+ by following this persistent link: https://squidle.org/geodata/explore/map?filters=%7B%22platform_ids%22%3A%5B%2222%22%5D%7D This dataset can be used to investigate species distributions, community patterns, provide a reference to assess change through time, and can be used to train algorithms to automatically detect and annotate marine fauna.
-
This dataset contains the supplementary data and code accompanying the publication: Ward, D., Hill, N., Melbourne-Thomas, J., Welsford, D., Arangio, R., McNeill, M., Wotherspoon, S., Ziegler, P., Corney, S. (2025) Exploring mechanisms of change in a Southern Ocean fishery with a co-produced network model, ICES Journal of Marine Science. The study aimed to elucidate likely responses of the system to change, and mechanisms by which environmental, ecological or fishery behavioural changes could affect catch rates and toothfish stocks in the Heard and McDonald Islands (HIMI) fishing area. In the study, we co-developed a set of 128 qualitative network models of the Heard and McDonald Islands (HIMI) Patagonian toothfish fishery–stock–ecosystem interactions system with knowledge holders from industry and science. These different model versions capture different possible configurations of interactions for which the sign of the effects (positive or negative) are unknown. For each model versions, we simulated 10,000 quantitative instances of the qualitative model. We analysed these model outputs to understand 1) mean qualitative responses of system components (nodes) in 8 test scenarios (press increases in environmental, fishery, or ecosystem nodes); 2) how ‘unknown’ effect signs affected qualitative responses of key nodes to change; and 3) relationships between responses and the strength of effects originating from nodes being perturbed. Please refer to Ward et al. (2025) for more detailed description of the methodology and findings, and the README file for description of data and code contained in this repository.
-
At the inception of our project, no study had examined particle fluxes in the Subantarctic Zone (SAZ) of the Southern Ocean, despite the fact that the SAZ represents a large portion of the total area of the Southern Ocean, serve as a strong sink for atmospheric (~1G t C yr-1 [Metzl et al., 1999]), and is central to hypotheses linking particle fluxes and climate change [Francois et al., 1997; Kumar et al., 1995; Sigman et al., 1999]. The SAZ serves as an interface between the cold nutrient-rich waters to its south and the nutrient-depleted subtropical gyres to its north. SAZ upper layers are marked by a thick layer of relatively homogenous Subantarctic Mode Water (SAMW), which overlies Antarctic Intermediate Water (AAIW). Both water masses are subducted northward beneath the subtropical gyres. Thus particles leaving the surface in these regions contribute to carbon redistribution via both the fraction that reaches the deep sea by settling and the fraction that is remineralized within SAMW or AAIW and subsequently subducted. The SAZ exhibits surface water carbon dioxide partial pressures well below atmospheric equilibrium, but PFZ waters are closer to atmospheric equilibrium in this sector [Metal et al., 1999; Poppet al., 1999]. The relative physical and biological contributions to these carbon dioxide partial pressure variations are unclear, but it is important to determine them because physical and biological carbon dioxide transfers are expected to show different responses to climate change [ Matear et al., 1999; Sarmiento and LeQuere, 1996]. For these reasons we focused on the SAZ and, for comparative purposes, on the PFZ to its south. We measured particle fluxes using moored sinking particle traps at three sites in the SAZ, in the PFZ, and beneath the Subantarctic Front (SAF), which separates them. This record describes particle flux data collected between 2000 and 2001. The NetCDF data contains the following variables. Please note not all variables are supplied in all files, specifically there are not uncertainty estimates and no quality control flags for this data. -----DATA DICTIONARY----- Name, description, units, standard name TIME, time, YYYY-MM-DD, time of sample midpoint TIME_START, time sample open, YYYY-MM-DD, time sample open NOMINAL_DEPTH, depth, m, nominal depth LATITUDE, latitude, degrees_north, latitude of anchor LONGITUDE, longitude, degrees_east, longitude of anchor pressure_actual, actual, dbar, actual pressure sample, sample number, 1, sample number sample_quality_control, quality flag for sample number, unitless, quality flag for sample number mass_flux, <1mm, mg m-2 d-1, particulate total mass flux mass_flux_uncertainty, uncertainty for particulate total mass flux, mg m-2 d-1,), uncertainty for particulate total mass flux mass_flux_quality_control, quality flag for particulate total mass flux, unitless, quality flag for particulate total mass flux SAL_BRINE, supernatant, 1, sample supernatant practical salinity SAL_BRINE_uncertainty, uncertainty for sample supernatant practical salinity, 1, uncertainty for sample supernatant practical salinity SAL_BRINE_quality_control, quality flag for sample supernatant practical salinity, unitless, quality flag for sample supernatant practical salinity pH_BRINE, supernatant, 1, sample supernatant pH NBS scale pH_BRINE_uncertainty, uncertainty for sample supernatant pH NBS scale, 1, uncertainty for sample supernatant pH NBS scale pH_BRINE_quality_control, quality flag for sample supernatant pH NBS scale, unitless, quality flag for sample supernatant pH NBS scale PC_mass_flux, <1mm, mg m-2 d-1, particulate total carbon mass flux PC_mass_flux_uncertainty, uncertainty for particulate total carbon mass flux, mg m-2 d-1, uncertainty for particulate total carbon mass flux PC_mass_flux_quality_control, quality flag for particulate total carbon mass flux, unitless, quality flag for particulate total carbon mass flux PN_mass_flux, <1mm, mg m-2 d-1, particulate total nitrogen mass flux PN_mass_flux_uncertainty, uncertainty for particulate total nitrogen mass flux, mg m-2 d-1, uncertainty for particulate total nitrogen mass flux PN_mass_flux_quality_control, quality flag for particulate total nitrogen mass flux, unitless, quality flag for particulate total nitrogen mass flux POC_mass_flux, <1mm, mg m-2 d-1, particulate organic carbon mass flux POC_mass_flux_uncertainty, uncertainty for particulate organic carbon mass flux, mg m-2 d-1, uncertainty for particulate organic carbon mass flux POC_mass_flux_quality_control, quality flag for particulate organic carbon mass flux, unitless, quality flag for particulate organic carbon mass flux PIC_mass_flux, <1mm, mg m-2 d-1, particulate inorganic carbon mass flux PIC_mass_flux_uncertainty, uncertainty for particulate inorganic carbon mass flux, mg m-2 d-1, uncertainty for particulate inorganic carbon mass flux PIC_mass_flux_quality_control, quality flag for particulate inorganic carbon mass flux, unitless, quality flag for particulate inorganic carbon mass flux BSi_mass_flux, <1mm, mg m-2 d-1, particulate biogenic silicon mass flux BSi_mass_flux_uncertainty, uncertainty for particulate biogenic silicon mass flux, mg m-2 d-1, uncertainty for particulate biogenic silicon mass flux BSi_mass_flux_quality_control, quality flag for particulate biogenic silicon mass flux, unitless, quality flag for particulate biogenic silicon mass flux TIME_END, time sample closed, YYYY-MM-DD, time sample closed Reference, citable reference DOI, DOI