 IMAS Metadata Catalogue
Modelled monthly distributions of priority seabirds (Southern Hemisphere) (NESP MaC 4.7)
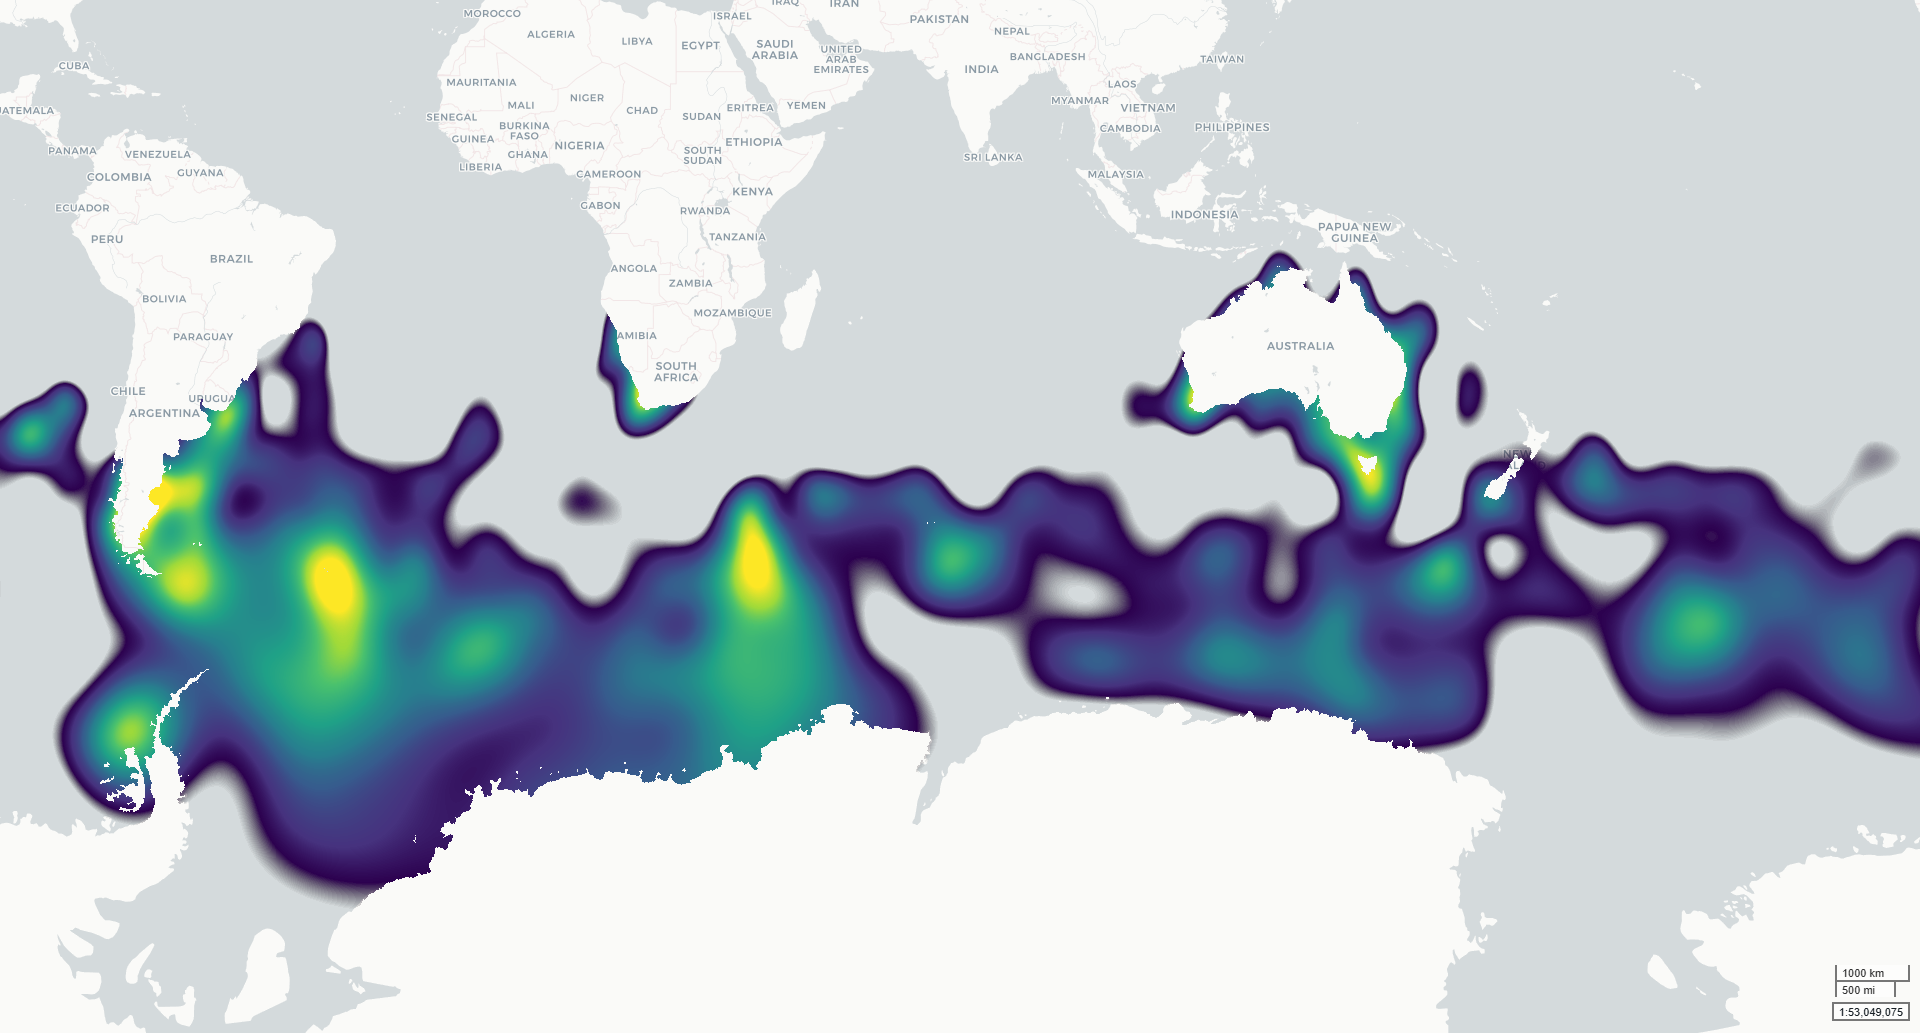
This dataset contains modelled monthly distributions of priority seabirds developed to support assessment of exposure to offshore renewable energy development as part of NESP MaC Project 4.7. Distributions are modelled for six species: Amsterdam Albatross, Gould’s Petrel, Gray-headed Albatross, Northern Royal Albatross, Shy Albatross and Southern Giant Petrel. The underlying project priority species were identified by NOPSEMA and DCCEEW, building on species priorities investigated under NESP MaC Project 3.21.
Continuous integrated space-time species distribution models were fitted across the Southern Hemisphere using observations from multiple data types, including tracking, presence-absence, abundance and presence-only records. The outputs describe spatial and seasonal variation in seabird distribution on a 5 km equal-area EASE-Grid 2.0 grid. Two related raster products are provided for each modelled taxon: (1) a normalised population-distribution surface representing the relative proportion of the modelled population within each grid cell; and (2) an estimated population-density surface (individuals per km²) derived by scaling these proportions by the estimated total adult population size (Southern hemisphere).
The models were developed to provide spatially and temporally explicit seabird distributions for cumulative risk assessment, including assessment of overlap with offshore renewable energy activities. Monthly outputs describe seasonal patterns across January–December.
***This data is under development. Access to the finalised spatial data will be provided once finalised, estimated early 2027.***
Simple
Identification info
- Date (Publication)
- 2026-10-10T00:00:00
Identifier
- Title
- Information and documentation - Digital object identifier system
- Citation identifier
- ISO 26324:2012
- Code
- 10.25959/A9G2-7252
- Codespace
- doi.org
- Description
- Digital Object Identifier (DOI)
Principal investigator
Principal investigator
Principal investigator
Principal investigator
Collaborator
Collaborator
Collaborator
- Credit
- The data collections described in this record are funded by the Australian Government Department of Climate Change, Energy, the Environment and Water (DCCEEW) through the NESP Marine and Coastal Hub. In addition to NESP (DCCEEW) funding, this project is matched by an equivalent amount of in-kind support and co-investment from project partners and collaborators.
- Status
- Under development
Point of contact
- Topic category
-
- Biota
Extent
))
Temporal extent
- Time period
- 2024-01-01 2024-12-31
- Maintenance and update frequency
- Not planned
- Keywords (Project)
-
- National Environmental Science Program (NESP) Marine and Coastal Hub
- Keywords (Theme)
-
- Offshore wind farms
- Offshore renewable energy
- Seabirds
- Keywords (Taxon)
-
- Diomedea amsterdamensis
- Pterodroma leucoptera
- Thalassarche chrysostoma
- Diomedea sanfordi
- Thalassarche cauta
- Macronectes giganteus
- Global Change Master Directory Earth Science Keywords, Version 8.5
Resource constraints
- Classification
- Unclassified
Resource constraints
- Linkage
-
https://licensebuttons.net/l/by/4.0/88x31.png
License Graphic
- Title
- Creative Commons Attribution 4.0 International License
- Alternate title
- CC-BY
- Edition
- 4.0
- Website
-
https://creativecommons.org/licenses/by/4.0/
License Text
- Other constraints
- Cite data as: Hosack, G., Peel, D., Foster, S., Hayes, K., El-Hachem, M., Williams, J., & Beeton, N. (2026). Modelled monthly distributions of priority seabirds (Southern Hemisphere) [Dataset]. Institute for Marine and Antarctic Studies. https://doi.org/10.25959/A9G2-7252
Resource constraints
- Other constraints
- This dataset is hosted by the University of Tasmania, on behalf of CSIRO and NESP Marine and Coastal Hub Project 4.7.
Associated resource
- Title
- NESP MaC Project 4.7 - Development of regional modelling and risk assessments to inform offshore renewable decision-making, 2024-2027 (CSIRO)
Identifier
- Association Type
- Dependency
- Initiative Type
- Project
- Language
- English
- Character encoding
- UTF8
Distribution Information
- Distribution format
-
- GeoTIFF
Resource lineage
- Statement
- Observations of priority seabirds were collated across the Southern Hemisphere from multiple sources and classified according to observation type, including tracking, mark-recapture, presence-absence, abundance, abundance-only and presence-only records. Data were standardised for modelling by converting observations to presence-absence form where appropriate. True absences were retained from structured presence-absence surveys, while pseudo-absences/background locations were generated for presence-only and tracking data. Continuous integrated space-time species distribution models were fitted using the mgcv R package (https://cran.r-project.org/web/packages/mgcv/index.html). The models combine multiple observation types to estimate how each species’ distribution varies temporally and spatially across the Southern Hemisphere. Spatial and seasonal patterns were estimated directly from the observations using a smooth space-time model with a complementary log-log link. Models were fitted across the Southern Hemisphere on a 5 km equal-area EASE-Grid 2.0 grid. Modelled distributions were normalised to represent the relative proportion of the population occurring in each grid cell across the spatial domain, with all valid grid cells summing to 1 for each monthly band. Estimated population density was then derived by scaling these proportions by an estimated adult population size for the Southern Hemisphere and dividing by result by 25 to return a metric of individuals per km². Bands 1–12 represent January–December, with 2024 used as a reference year for the modelled annual cycle. 𝗗𝗮𝘁𝗮 𝗗𝗶𝗰𝘁𝗶𝗼𝗻𝗮𝗿𝘆 The dataset contains two 12-band raster products for each species: *_ProportionN.tif = proportion of the modelled population occurring within each 5 km grid cell. All valid grid cells sum to 1 for each monthly band. *_individuals_per_km2.tif = estimated population density within each grid cell, expressed as adult individuals per km² and derived from the corresponding population-proportion surface.
- Hierarchy level
- Dataset
- Hierarchy level
- Dataset
Metadata
- Metadata identifier
- urn:uuid/f1b12505-ac1d-4714-803b-d4f65f897879
- Language
- English
- Character encoding
- UTF8
- Parent metadata
Type of resource
- Resource scope
- Dataset
- Metadata linkage
-
https://metadata.imas.utas.edu.au/geonetwork/srv/eng/catalog.search#/metadata/f1b12505-ac1d-4714-803b-d4f65f897879
Point of truth URL of this metadata record
- Date info (Creation)
- 2026-10-10T00:00:00
- Date info (Revision)
- 2026-10-19T17:55:00
Metadata standard
- Title
- ISO 19115-3:2018
Overviews
Spatial extent
Provided by