IMAS Metadata Catalogue
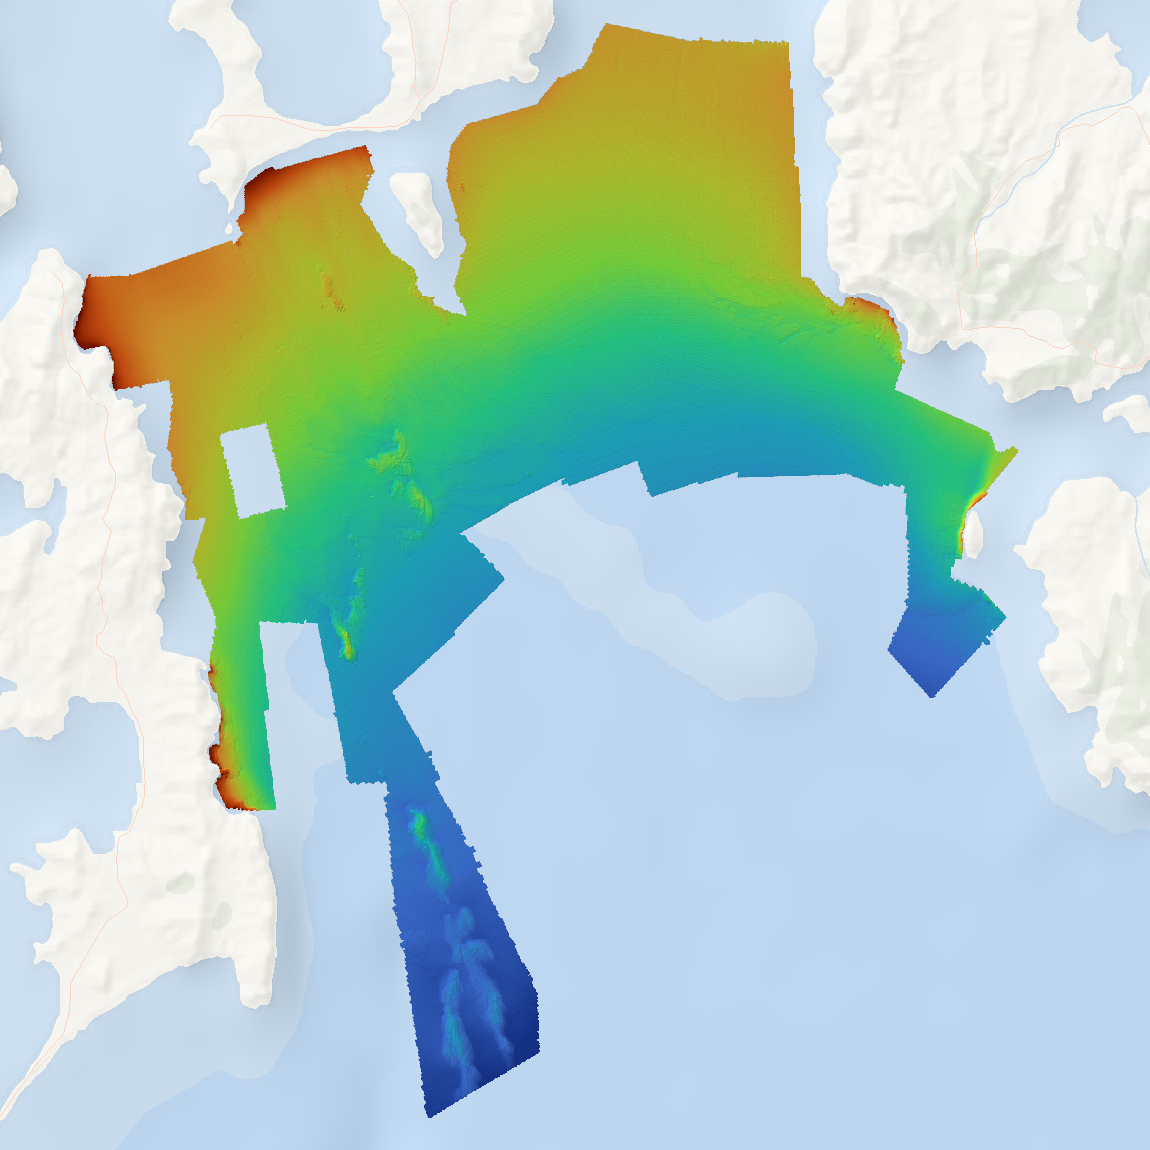
Storm Bay Bathymetry - 5m resolution (FRDC Project 2018/131)
High resolution bathymetry data was collected for Storm Bay, Tasmania as part of the FRDC project 2018-131 'Storm Bay Observing System: Assessing the Performance of Aquaculture Development. Objective 2: Provide a comprehensive map of benthic habitats and bathymetry of the Storm Bay region
and assessment of change at key focus areas'.
Data is supplied as a single Web Map Service of hillshaded bathymetry for the mapped region. Data is available for download as (1) bathymetry, and (2) hillshade tiff files.
Simple
Identification info
- Date (Publication)
- 2025-12-10T00:00:00
Identifier
- Title
- Information and documentation - Digital object identifier system
- Citation identifier
- ISO 26324:2012
- Code
- 10.25959/MEHM-DE40
- Codespace
- doi.org
- Description
- Digital Object Identifier (DOI)
Principal investigator
Collaborator
- Credit
- The study was funded by FRDC project 2018-131 Storm Bay Observing System: Assessing the Performance of Aquaculture Development
- Status
- Completed
Point of contact
- Topic category
-
- Oceans
- Geoscientific information
Extent
))
Temporal extent
- Time period
- 2020-02-03 2022-09-30
Vertical element
- Minimum value
- 3
- Maximum value
- 64
- Identifier
- EPSG::5715
- Name
- MSL depth
- Maintenance and update frequency
- Not planned
- Keywords (Theme)
-
- Marine
- Multibeam
- Mapping
- Global Change Master Directory Earth Science Keywords, Version 8.5
Resource constraints
- Linkage
-
https://licensebuttons.net/l/by/4.0/88x31.png
License Graphic
- Title
- Creative Commons Attribution 4.0 International License
- Alternate title
- CC-BY
- Edition
- 4.0
- Website
-
https://creativecommons.org/licenses/by/4.0/
License Text
- Other constraints
- Cite data as: Lacharité, M., & Ross, D. J. (2025). Storm Bay Bathymetry - 5m resolution (FRDC Project 2018/131) [Data set]. Institute for Marine and Antarctic Studies. https://doi.org/10.25959/MEHM-DE40
- Other constraints
- This dataset is not to be used for navigational purposes.
- Language
- English
- Character encoding
- UTF8
Content Information
- Content type
- Physical measurement
Distribution Information
- Distribution format
-
- tiff
- OnLine resource
- DATA ACCESS
- OnLine resource
-
Associated report
Lacharité, M., Pender A, and Ross, J. Institute for Marine and Antarctica Studies (2024). Storm Bay Observing System: Assessing the Performance of Aquaculture Development. Objective 2: Provide a comprehensive map of benthic habitats and bathymetry of the Storm Bay region and assessment of change at key focus areas. FRDC Report.
- OnLine resource
-
Project webpage
Storm Bay Observing System: An evaluation of the sampling parameters and design for assessing the performance of salmon aquaculture. FRDC Project 2018/131
- OnLine resource
-
Storm_Bay_bathymetry_2022_5m_composite
MAP - Storm Bay 5m bathymetry composite
Resource lineage
- Statement
- Multibeam data were collected aboard the RV Noctiluca (IMAS/University of Tasmania) with a ENL WASSP F3 operating at a default operating frequency of 160 kHz. Motion was corrected with the inertial motion unit Advanced Navigation Spatial, with an accuracy of 0.1° for roll, pitch and yaw, and 5 cm or 5% of water depth for heave. Heading was provided by a Hemisphere V103 (accuracy: 0.3°). Geographic positioning was provided by a Fugro 9205 GNSS receiver (Trimble GA 810 antenna) augmented with differential positioning with the Marinestar G2 (GPS/GLONASS) system (in World Geodetic System 1984; WGS84). Bathymetric surfaces were created for each survey day within 32 subregions within Storm Bay (e.g., Day XX-Region X). GSF files were processed using QPS Qimera 2.1. Data were originally gridded at 2-m horizontal resolution in WGS84 UTM Zone 55S. Bathymetric data were corrected for sound velocity and tidal amplitude. Depths were corrected for tidal amplitude to the Lowest Astronomical Tide (LAT) based on high/low tidal predictions at the Hobart or Parsons Bay stations on survey days (see http://www.bom.gov.au/autralia/tides) and using the formula to derive tidal amplitudes at 1-min intervals: Di=D + [h1+(h2-h1)*cos(π*((t-t1)/(t2-t1 )+1))+1)/2] Where Di is corrected depth and D is measured depth, h1,2 correspond to the predicted heights of the high and low tides, t1,2 are the times of the high and low tides with t being each 1-min time step. Depths were subsequently corrected to Mean Sea Level (MSL) using the AusGeoid09 model, with LAT sitting 0.88 m below MSL in Storm Bay. The bathymetric surface was manually corrected for outliers and exported as a GeoTIFF. Bilinear interpolation was used to fill gaps, and the surface was smoothed with a low-pass filter using a 3x3 moving window to remove noise. The final gridded surface was generated by merging all grids using a bulk-shit approach, i.e., average discrepancy in depth (m) in areas of overlap, over consecutive days, using the earliest mosaic as reference. The final bathymetric grid is made available at a horizontal resolution of 5 m.
- Hierarchy level
- Dataset
- Hierarchy level
- Dataset
Metadata
- Metadata identifier
- urn:uuid/368783d1-6379-44c7-911d-7853c3979be6
- Language
- English
- Character encoding
- UTF8
Type of resource
- Resource scope
- Dataset
- Name
- IMAS Dataset level record
- Metadata linkage
-
https://metadata.imas.utas.edu.au/geonetwork/srv/eng/catalog.search#/metadata/368783d1-6379-44c7-911d-7853c3979be6
Point of truth URL of this metadata record
- Date info (Creation)
- 2024-10-14T00:00:00
- Date info (Revision)
- 2026-04-27T21:27:50
Metadata standard
- Title
- ISO 19115-3:2018
Overviews
Spatial extent
Provided by