 IMAS Metadata Catalogue
Distribution of Eastern Indian Ocean pygmy blue whales and potential impacts of offshore wind developments (NESP MaC 4.8)
The offshore renewable energy (ORE) sector is rapidly developing in Australian waters to support national carbon emission targets. However, new marine infrastructure can introduce additional risks to threatened species. The eastern Indian Ocean pygmy blue whale (Balaenoptera musculus brevicauda) was identified by the Australian Government as a priority species for assessing potential ORE impacts. This subspecies ranges from the Subtropical Convergence (~40-45°S) to Southeast Asia (~2°S), with much of its documented distribution occurring within Australia’s Exclusive Economic Zone. Its distribution overlaps with multiple anthropogenic activities, indicating likely exposure to existing and emerging pressures.
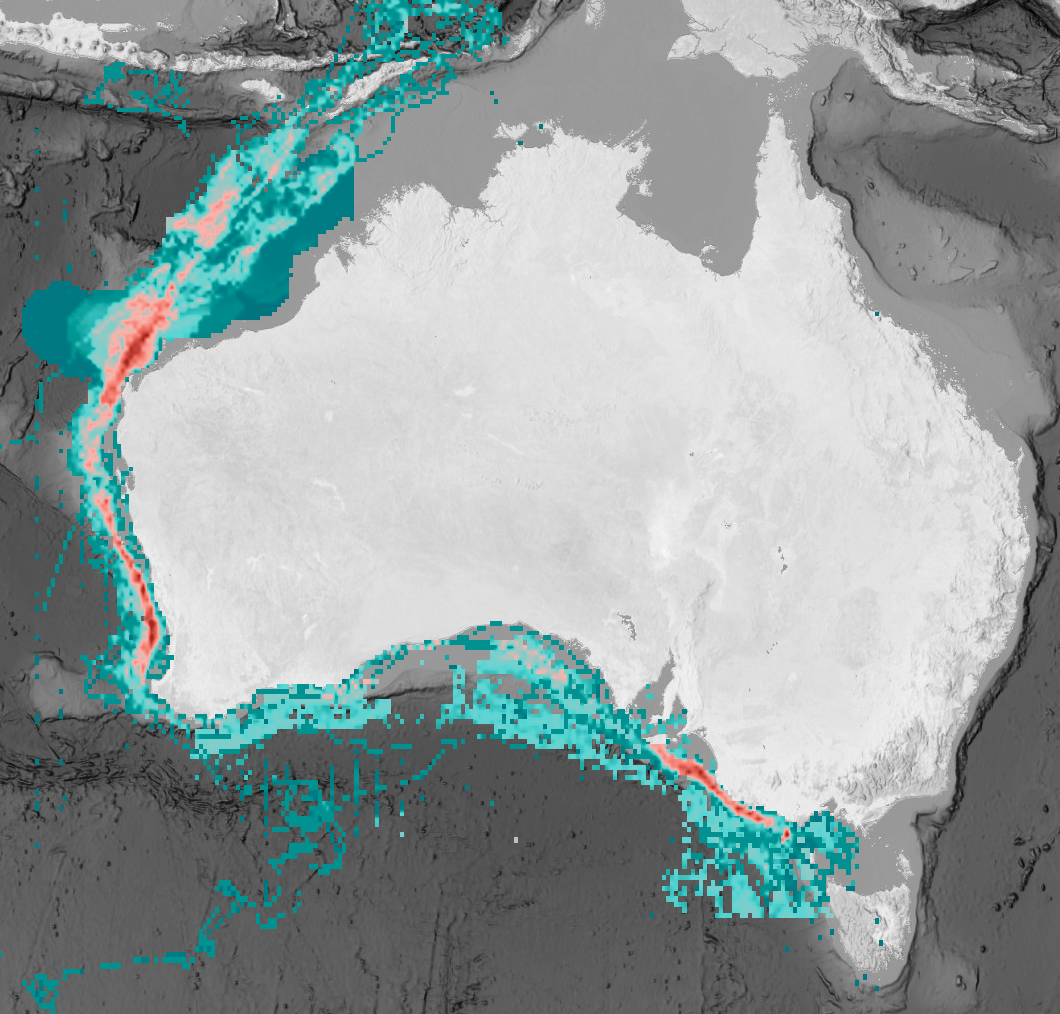
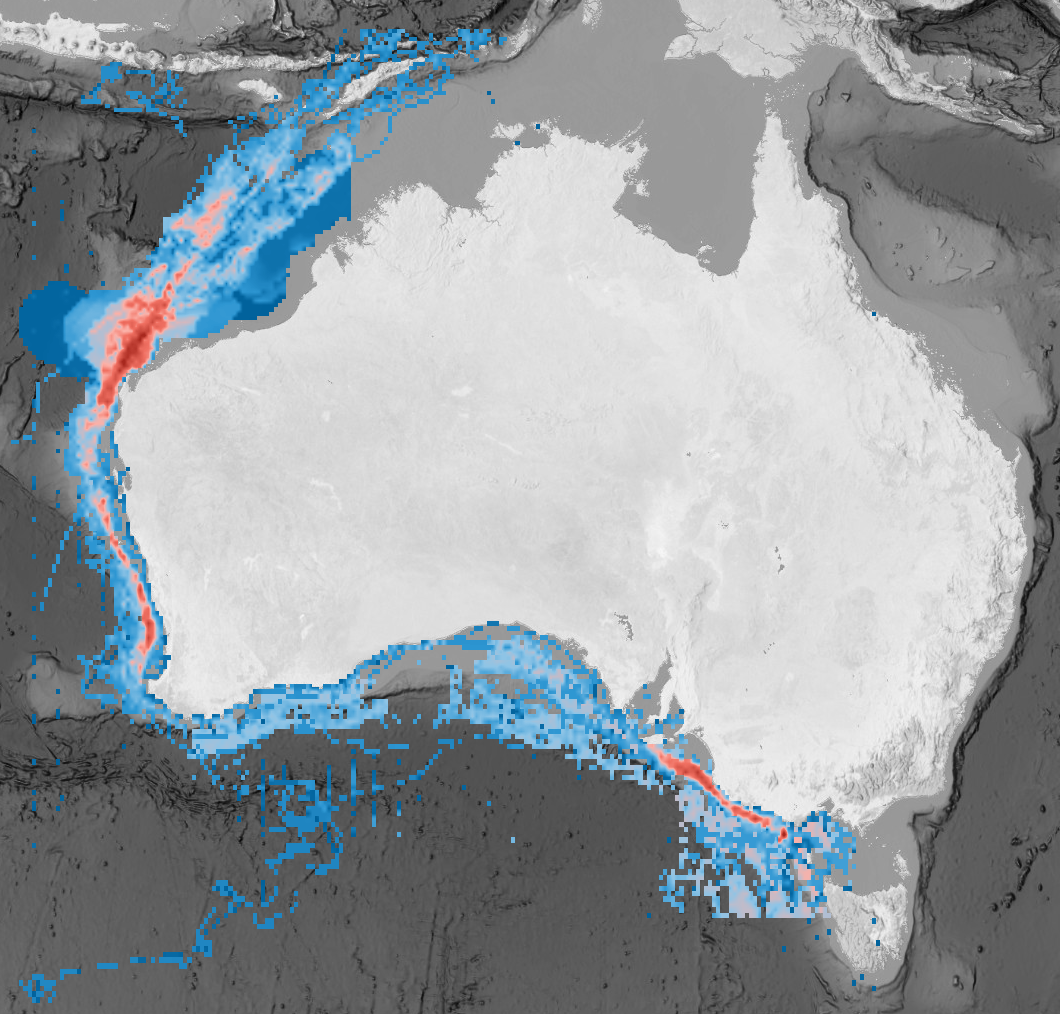
This dataset compiled available spatial information to quantify the full distribution and foraging distribution of pygmy blue whales, and to assess exposure to individual and cumulative threats across the species’ range. The threat exposure analysis incorporated expert elicitation to estimate the probability of exposure arising from spatial overlap between pygmy blue whale distribution and anthropogenic pressures, with particular focus on areas undergoing ORE development.
The cumulative exposure assessment indicated relatively low exposure of pygmy blue whales to existing threats within Australian waters, including within declared ORE areas. However, several data and knowledge gaps were identified that should be addressed before further ORE development. The resulting spatial layers provide a baseline for impact assessment by industry and regulators, and support decision-making for sustainable ORE development in Australian waters.
Simple
Identification info
- Date (Publication)
- 2025-11-29T00:00:00
Identifier
- Title
- Information and documentation - Digital object identifier system
- Citation identifier
- ISO 26324:2012
- Code
- 10.25959/BHCT-DD51
- Codespace
- doi.org
- Description
- Digital Object Identifier (DOI)
Principal investigator
- Credit
- The data collections described in this record are funded by the Australian Government Department of Climate Change, Energy, the Environment and Water (DCCEEW) through the NESP Marine and Coastal Hub. In addition to NESP (DCCEEW) funding, this project is matched by an equivalent amount of in-kind support and co-investment from project partners and collaborators.
- Status
- Completed
Point of contact
- Topic category
-
- Biota
- Oceans
Extent
))
Temporal extent
- Time period
- 2024-04-01 2025-01-31
- Maintenance and update frequency
- Not planned
- Keywords (Project)
-
- National Environmental Science Program (NESP) Marine and Coastal Hub
- Keywords (Theme)
-
- Offshore wind farms
- Keywords (Taxon)
-
- pygmy blue whale
- Global Change Master Directory Earth Science Keywords, Version 8.5
Resource constraints
- Classification
- Unclassified
Resource constraints
- Other constraints
- This dataset is hosted by the University of Tasmania, on behalf of the Australian Institute of Marine Science and NESP Marine and Coastal Hub Project 4.8.
Resource constraints
- Linkage
-
https://licensebuttons.net/l/by/4.0/88x31.png
License Graphic
- Title
- Creative Commons Attribution 4.0 International License
- Alternate title
- CC-BY
- Edition
- 4.0
- Website
-
https://creativecommons.org/licenses/by/4.0/
License Text
- Other constraints
- Cite data as: Cerqueira Ferreira, L., Moller, L., & Thums, M. (2025). Distribution of Eastern Indian Ocean pygmy blue whales and potential impacts of offshore wind developments [Data set]. Institute for Marine and Antarctic Studies. https://doi.org/10.25959/BHCT-DD51
Associated resource
- Title
- NESP MaC Project 4.8 - Potential impacts of offshore wind developments on eastern Indian Ocean pygmy blue whales, 2024-2025 (AIMS)
Identifier
- Association Type
- Dependency
- Initiative Type
- Project
- Language
- English
- Character encoding
- UTF8
Content Information
- Content type
- Physical measurement
Identifier
- Code
- Satellite telemetry
- Name
- Relative distribution
Identifier
- Code
- Relative distribution
- Name
- relative distribution
Distribution Information
- Distribution format
-
- GeoTIFF, Shapefile
- OnLine resource
- DATA ACCESS - browse and download available files
- OnLine resource
- Explore maps in the interactive Seamap Australia portal
- OnLine resource
-
MaC_4-8_PygmyBlueWhales_tracking
MAP - Distributrion of Pygmy blue whales from tracking data
- OnLine resource
-
MaC_4-8_PygmyBlueWhales_habitat_suitability_trackingdata
MAP - Habitat suitability for Pygmy blue whales from tracking data
- OnLine resource
-
MaC_4-8_PygmyBlueWhales_relative_distribution
MAP - Relative distribution of Pygmy blue whales (combined sources)
- OnLine resource
-
MaC_4-8_Threats_to_PygmyBlueWhales
MAP - Key threats to Pygmy blue whales
- OnLine resource
-
MaC_4-8_PygmyBlueWhales_cumulative_exposure_threats
MAP - Cumulative exposure of Pygmy blue whales to ORE threats
Resource lineage
- Statement
- 𝗣𝘆𝗴𝗺𝘆 𝗕𝗹𝘂𝗲 𝗪𝗵𝗮𝗹𝗲 𝗱𝗶𝘀𝘁𝗿𝗶𝗯𝘂𝘁𝗶𝗼𝗻 ---Tracking data--- Satellite telemetry data from 60 pygmy blue whales were compiled from multiple long-term tracking programs across southern Australia and Indonesia, spanning 22 years and a range of tag types. All tracks were processed using a state-space model to account for location error and movement autocorrelation, and a time-weighting used to reduce spatial and temporal bias near tagging sites caused by tag transmission decay. A move-persistence model was used to classify behaviour relative to the directionality of movement, with 0 representing 'area restricted search' (foraging), and 1 representing fast directional movement (migration or transit). ---Habitat suitability--- Predictions of suitable habitat were developed by incorporating tracking data and passive acoustic data (predicted spatial distribution of unique whale songs) for northwest Australia. Spatial predictions were validated and normalised between 0 and 1 to generate habitat suitability maps for (1) migration; and (2) foraging behaviour. ---Combined relative distribution--- Tracking and habitat suitability maps were combined with presence data from aerial surveys in southern Australia and the Bass Strait, vessel surveys led by the offshore resource industry, the marine mammal observer (MMO) dataset hosted by the AAD, and historical pygmy blue whale catch records obtained from the International Whaling Commission. From these, relative distribution was modelled using a 10 km × 10 km grid across the Australian EEZ to create a combined-sources distribution for pygmy blue whales. Where behaviour data were available, foraging distribution was calculated in addition to an overall distribution. For each input source, whale occurrence within 10 km × 10 km grid cells was first normalised to a 0–1 scale, allowing metrics based on different units (e.g. occupancy time vs number of whales) to be comparable. These normalised layers were then summed and the resulting surface was re-normalised from 0–1 to generate a final relative-distribution index. ---Important pygmy blue whale areas--- Important pygmy blue whale areas for (1) foraging; and (2) distribution/migration were identified using the combined, normalised relative-distribution maps. Important foraging areas were defined as the top 50% of the combined foraging distribution, while overall important areas were calculated as the top 75% of the combined overall distribution. 𝐓𝐡𝐫𝐞𝐚𝐭𝐬 ---Threat distribution--- Six key threats to pygmy blue whales in Australian waters were identified: climate change, displacement, entanglement pollution, underwater noise, and vessel strike. Each threat was associated with one or more pressures linked to human activities in the marine ecosystem. Spatial data for each of the pressures were obtained from open free sources and converted into pressure intensity on a 10 km × 10 km grid. For each threat, all relevant overlapping spatial pressures were summed and normalised between 0 (no threat present) and 1 (maximum threat intensity), which allowed intensity to be compared across threats. ---Cumulative exposure to threats--- Cumulative exposure of pygmy blue whales to key threats was calculated from both their foraging and overall distributions. Expert elicitation was used to assess the probability of exposure to each threat where whale distribution and threat layers overlapped. Each threat layer was weighted by the expert-derived probabilities of exposure. and then summed on a 10 km × 10 km grid to represent the combined intensity of all threats. The combined threat intensity was then multiplied by either the overall combined relative distribution of pygmy blue whales, or the foraging-only distribution. The resulting maps show where pygmy blue whales are most at-risk from climatic and anthropogenic threats.
- Hierarchy level
- Dataset
- Hierarchy level
- Dataset
Metadata
- Metadata identifier
- urn:uuid/310ecc6f-0530-446e-a141-487a7f65300c
- Language
- English
- Character encoding
- UTF8
- Parent metadata
Type of resource
- Resource scope
- Dataset
- Metadata linkage
-
https://metadata.imas.utas.edu.au/geonetwork/srv/eng/catalog.search#/metadata/310ecc6f-0530-446e-a141-487a7f65300c
Point of truth URL of this metadata record
- Date info (Creation)
- 2025-11-10T00:00:00
- Date info (Revision)
- 2026-05-31T11:18:06
Metadata standard
- Title
- ISO 19115-3:2018
Overviews
Spatial extent
Provided by
