 IMAS Metadata Catalogue
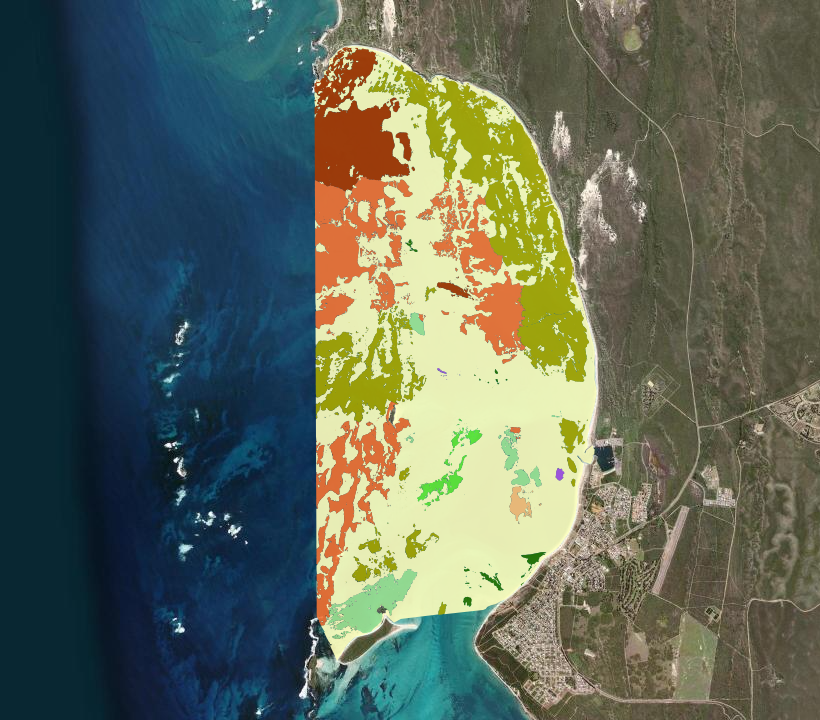
Jurien Bay benthic habitat mapping
Jurien Bay Boat Harbour is located north of the town of Jurien Bay, ~250 km north of Perth, Western Australia. The Boat Harbour services a range of government, recreational and commercial vessels and is managed by the WA Department of Transport (DoT).
Wrack and marine sediments frequently accumulate in the Boat Harbour, negatively affecting the navigability, environment and aesthetic quality of the Harbour. To manage these impacts, routine maintenance dredging is undertaken by DoT.
To inform future dredging requirements and marine environmental management of the Boat Harbour, BMT undertook benthic habitat mapping of Jurien Bay in November 2017 on behalf of DoT. The objectives of the mapping project were to:
i. collect baseline data on the spatial extent and characteristics of benthic habitats in the mapping area, and
ii. qualitatively characterise the extent of benthic primary producer habitat surrounding the Boat Harbour, and develop a mapping product to inform dredging operations and potential future environmental approvals applications, if necessary.
Mapping was conducted by first collating satellite imagery to identify benthic habitat features to be ground-truthed by towed video. Video footage was annotated with biological attributes and combined with the satellite imagery to create classified benthic habitat maps of an area offshore of the Boat Harbour.
See the "Lineage" section of this record and attached survey report for detailed methodology.
Simple
Identification info
- Date (Publication)
- 2024-02-05T00:00:00
Owner
- Credit
- Report prepared for BMT Group Ltd for the WA Department of Transport (DoT).
- Status
- Completed
Point of contact
- Topic category
-
- Biota
- Environment
Extent
))
Temporal extent
- Time period
- 2017-12-24 2018-03-01
- Maintenance and update frequency
- Not planned
- Global Change Master Directory Earth Science Keywords, Version 8.5
Resource constraints
- Linkage
-
https://licensebuttons.net/l/by/4.0/88x31.png
License Graphic
- Title
- Creative Commons Attribution 4.0 International License
- Alternate title
- CC-BY
- Edition
- 4.0
- Website
-
https://creativecommons.org/licenses/by/4.0/
License Text
- Other constraints
- Cite data as: Government of Western Australia Department of Transport (2018). Jurien Bay benthic habitat mapping [Data set]. Institute for Marine and Antarctic Studies. Data accessed from https://metadata.imas.utas.edu.au/geonetwork/srv/eng/catalog.search#/metadata/0985c77d-5b2e-498b-9016-bfcce78df2da on [access date].
- Other constraints
- This dataset is hosted by the Institute for Marine and Antarctic Studies (IMAS), University of Tasmania, on behalf of the WA Department of Transport for the purposes of the Seamap Australia collaborative project.
- Language
- English
- Character encoding
- UTF8
Content Information
- Content type
- Physical measurement
- Description
- Appended to original data for styling purposes for the Seamap Australia Project.
- Name
- Benthic habitat
- Name
- SM_HAB_CLS
Distribution Information
- Distribution format
-
- ESRI Shapefile
- OnLine resource
-
SHAPE-ZIP
DATA ACCESS - Jurien Bay benthic habitat mapping
- OnLine resource
-
seamap:SeamapAus_WA_JurienBay_benthic_habitat_2018
MAP - Jurien Bay benthic habitat mapping
- OnLine resource
- View & explore data in Seamap Australia
- OnLine resource
- Associated survey report
Resource lineage
- Statement
- ---Remote Data Collection--- Multispectral satellite imagery from 24 August 2017 was used to identify benthic habitat assemblages for mapping the study area of Jurien Bay Boat Harbour. Panchromatic (greyscale) and multispectral (8 spectral bands) satellite imagery was acquired from the DigitalGlobe WorldView-2 sensor with a resolution of 2 m. The image selected had the clearest water and highest visibility of benthic features in the area of primary interest. Some turbidity was evident over the northern part of the image, but the visibility over these areas was considered sufficient to allow for spectral separation of habitat categories. Satellite imagery was assessed for possible artefacts or sun-glint, but no corrections were required. ---Ground-Truthing Data--- Ground truth data were collected using towed video camera surveys on 9 and 11 November 2017 and on 1 March 2018. This data data was used to augment the spatial data from the satellite image analysis, and to enable definition of benthic habitat assemblages within the study area. In total, 60 towed video transects were surveyed. Transect lengths varied from ~100 m to ~1.6 km, with a total survey transect distance of ~27.5 km. Transect positions were stratified to target areas of particular benthic features (sediments, reefs, seagrass, macroalgae habitats) prior to field mobilisation. Most video frames covered a ~1–2 m wide band of substrate, resulting in ~4.1 hectares (or 0.11% of the mapping area) of benthic habitat surveyed. Within this survey area, the video data analysis produced ~47,690 units of classified habitat data (with each unit corresponding to ~1.0 m² of mapping area). Towed video data were collected using a towed camera system configured with two digital cameras (one standard definition and one high definition) mounted in a water proof sled/housing on a 50 m umbilical. The primary camera was mounted to a sled on a 45° angle, pointing forward. Real-time positioning software logged location every 1 second. ---Classification Procedure--- Habitat mapping was performed using a supervised Maximum Likelihood classifier. Training areas were based on areas with ground-truthing towed video data. A random split was applied to the ground-truthing points to split them into classification (70%) and validation (30%) data. The 70% withheld classification data were used to generate spectral signatures for the classification. Habitats could be reliably divided into vegetated cover of varying density, and non-vegetated areas, but could not be further classified into seagrass and reef categories as a result of high spectral similarity between seagrass and other vegetated areas (e.g. macroalgae, turfing algae). Therefore, categories were mapped to (1) vegetated; and (2) non-vegetated areas. Vegetated areas included all regions with sparse to dense seagrass or macroalgal cover, while non-vegetated areas combined sand and bare rock pavement/reef. Seagrass and macroalgal categories were manually assigned at a later stage. Vegetated areas were defined as either dense (having no obvious gaps in the vegetation cover based on visual assessment of imagery) or sparse vegetation (containing areas of bare sand or reef in between the vegetation cover). Following the supervised classification, the classified images were visually assessed for consistency across the study area. Bathymetric charts were also used to help delineate reef and non-reef areas based on visual assessment of the depth differences between features. The bathymetric information was then integrated with the habitat classification to allow for the separation of vegetated areas, according to reef or non-reef substrate. Ground truthing data were used to manually define seagrass and macroalgal habitats over the vegetated reef and non-reef areas. Post-processing was then applied to improve the classification over areas of noise in the data, or misclassification resulting from spectral similarities between the categories, especially in more sparsely vegetated areas, and smooth the boundary between classified habitats. Areas affected by turbidity were improved by applying additional image assessments and contrast stretches to maximise the visibility and confirm the extent of habitats. A minimum mapping unit of ~36 m2 was considered suitable to remove small classified areas and merge with neighbouring polygons. ---Accuracy--- An accuracy assessment was performed on the habitat classification using the 30% withheld validation ground truthing data for the vegetated and non-vegetated categories. The assessment of vegetated and non-vegetated categories achieved a very high overall accuracy of 93.40% and Kappa statistic of 0.87. The Kappa value measures agreement between the classification of categorical data, and recognises the agreement that could occur by chance. Kappa values over 0.40 are considered as representing moderate to strong agreement.
- Hierarchy level
- Dataset
Metadata
- Metadata identifier
- urn:uuid/0985c77d-5b2e-498b-9016-bfcce78df2da
- Language
- English
- Character encoding
- UTF8
- Parent metadata
Type of resource
- Resource scope
- Dataset
- Name
- IMAS Dataset level record
- Metadata linkage
-
https://metadata.imas.utas.edu.au/geonetwork/srv/eng/catalog.search#/metadata/0985c77d-5b2e-498b-9016-bfcce78df2da
Point of truth URL of this metadata record
- Date info (Creation)
- 2025-02-04T00:00:00
- Date info (Revision)
- 2026-06-29T12:44:38
Metadata standard
- Title
- ISO 19115-3:2018
Overviews
Spatial extent
Provided by
